This blog post dives into how to get a better understanding of an Android native function by taking full advantage of both Frida and QBDI.
Introduction
Reverse engineering of Android applications is usually considered as somewhat effortless because of the possibility of retrieving the Java representation of the application's code. An attacker is basically able to read through a human-readable version of the code in order to quickly extract the intellectual property, gather some assets, find vulnerabilities and so on. Nowadays, most of the Android application editors are aware of this weakness and try their best to make reverse engineers' work harder. They often rely on integrating obfuscation strategies or shifting sensitive features from Java/Kotlin side to native code thanks to Java Native Interface (shortened JNI [1]). However, the reverse engineering process gets much more complex when they decide to use both — that is, obfuscated native code. As a result, statically looking into the native library's disassembly turns out to be pretty tedious and time-consuming. Fortunately, inspection at runtime is still possible and offers a convenient way to efficiently grasp the inner mechanisms of the application, even over obfuscation.
Since protections against regular debuggers are quite common among popular applications, using a Dynamic Binary Instrumentation (DBI) framework such as Frida [2] remains a great option for a thorough examination. Technically speaking, amongst other powerful features, Frida allows users to inject their own code at the beginning and the end of a native function or replace the whole implementation. Nonetheless, Frida lacks granularity at some point, especially when it comes to inspecting the execution at the instruction scale. In this context, QBDI, a DBI framework we have developed at Quarkslab, can give Frida a hand determining what parts of the code have been executed when calling a given native function.
This article is the follow-up of the talk that has been given at Pass The Salt 2020. Video [3] and slide deck [4] are available online.
Getting started
First of all, we have to properly set our testing environment up. We assume that the device has been rooted and Frida server is already running and ready for use. Besides Frida, we need QBDI to be installed as well. We can either compile it from sources [5] or download a release build for Android. Archives can be retrieved directly from the official page [6]. After decompressing, we have to push the shared library called libQBDI.so on the device, in /data/local/tmp. Along with it, we can also notice the QBDI bindings defined in frida-qbdi.js [7] — this file is responsible for providing an interface over QBDI functions. In other words, it acts as a bridge between QBDI and Frida.
Note that SELinux has to be turned off beforehand otherwise Frida won't be able to load the QBDI shared library into memory due to some restriction rules. An explicit error message would show up, telling that permissions are denied. In most cases, merely running this command line with root privileges should do the job:
setenforce 0
We now have all the requirements for writing a script based on both Frida and QBDI.
Tracing a native function
JNI_OnLoad() [8] is always worth examining while performing reverse engineering on JNI shared libraries. Indeed, this function is called right after the library loading and is responsible for initialisation. It is able to interact with the Java side such as setting class' attributes, calling Java functions and registering other native methods through several JNI functions [9]. Editors often rely upon these properties for hiding some sensitive checks and secret inner mechanisms.
In this part, let's pretend we would like to analyse a popular Android application — say Whatsapp [10], whose package name is com.whatsapp, which is currently the most widespread instant-messaging solution on Android. It embeds a bunch of shared libraries, one of which is libwhatsapp.so. Note that this library doesn't lie in the conventional lib/ directory as there's a decompression mechanism at runtime which extracts it from an archive and then loads it into memory. We're aiming at figuring out what its initialisation function is doing.
Frida only
/**
 * frida -Uf com.whatsapp --no-pause -l script.js
 */

function processJniOnLoad(libraryName) {
    const funcSym = "JNI_OnLoad";
    const funcPtr = Module.findExportByName(libraryName, funcSym);

    console.log("[+] Hooking " + funcSym + "() @ " + funcPtr + "...");
    // jint JNI_OnLoad(JavaVM *vm, void *reserved);
    var funcHook = Interceptor.attach(funcPtr, {
        onEnter: function (args) {
            const vm = args[0];
            const reserved = args[1];
            console.log("[+] " + funcSym + "(" + vm + ", " + reserved + ") called");
        },
        onLeave: function (retval) {
            console.log("[+]\t= " + retval);
        }
    });
}

function waitForLibLoading(libraryName) {
    var isLibLoaded = false;

    Interceptor.attach(Module.findExportByName(null, "android_dlopen_ext"), {
        onEnter: function (args) {
            var libraryPath = Memory.readCString(args[0]);
            if (libraryPath.includes(libraryName)) {
                console.log("[+] Loading library " + libraryPath + "...");
                isLibLoaded = true;
            }
        },
        onLeave: function (args) {
            if (isLibLoaded) {
                processJniOnLoad(libraryName);
                isLibLoaded = false;
            }
        }
    });
}

Java.perform(function() {
    const libraryName = "libwhatsapp.so";
    waitForLibLoading(libraryName);
});
First, thanks to the convenient API Frida provides, we can easily hook the function we want to look into. However, since libraries embedded within Android applications are dynamically loaded through System.loadLibrary(), which calls native android_dlopen_ext() under the hood, we need to wait for the targeted library to be put into the process' memory. Using this script, we can solely access the inputs (arguments) and output (return value) of the function — that is, we're at the function layer. It's quite limiting and this alone is basically not enough to accurately grasp what's going on inside. Therefore, in this precise situation, we would like to inspect the function thoroughly, at a lower level.
Frida + QBDI
Importing features offered by QBDI can help us overcome this issue. Indeed, this DBI framework allows users to perform a fine-grained analysis by tracing executed instructions. It is pretty useful for us because we could have an in-depth understanding of the function we're targeting.
The idea is, instead of letting JNI_OnLoad() run as during a regular startup, to execute it through an instrumented context in order to know exactly what has been executed, at the basic block/instruction scale. Since we can combine these two DBI frameworks together, this brand-new part can be integrated on top of the Frida script we have written previously.
However, the Interceptor.attach() function we're using solely lets us define onEnter and onLeave callbacks. It means that the genuine function is always executed, regardless of what your entry callback is supposed to do. Thus, the initialisation function will be executed twice — first through QBDI and then normally. It turns out to be problematic because depending on the case, some unexpected runtime errors could show up as this function is intended to be called once.
Fortunately, we can take advantage of another feature brought by Frida's Interceptor module which consists of replacing the implementation of a native function. Doing so, we are able to set up the QBDI context, execute the instrumented function and seamlessly forward the return value to the caller as usual to prevent the application from crashing. This technique aims to keep the process stable enough to resume the normal execution.
Nevertheless, we're still facing a problem here: the initial function has been completely overridden by our own new implementation. In other words, the function's code is not the original one — it has been instrumented by Frida earlier. Within our code, we must thus revert to the genuine version before executing the function with QBDI.
After modifying the script, the processJniOnLoad() function looks as follows:
function processJniOnLoad(libraryName) {
    const funcSym = "JNI_OnLoad";
    const funcPtr = Module.findExportByName(libraryName, funcSym);

    console.log("[+] Replacing " + funcSym + "() @ " + funcPtr + "...");
    // jint JNI_OnLoad(JavaVM *vm, void *reserved);
    var replacement = Interceptor.replace(funcPtr, new NativeCallback(function (vm, reserved) {
        const vm = args[0];
        const reserved = args[1];
        console.log("[+] " + funcSym + "(" + vm + ", " + reserved + ") called");
        Interceptor.revert(funcPtr); // revert to the genuine implementation
        Interceptor.flush(); // ensure changes have been actually committed
        var retVal = qbdiExec(this.context, funcPtr, funcSym, [vm, reserved], true);
        processJniOnLoad(libraryName, funcSym); // replace the implementation again for a potential call later on
        return retVal;
    }, "long", ["pointer", "pointer"]));
}
Initialisation
Let's now write the function responsible for executing the function in the context of QBDI. In the first place, we need to initialise a VM, instantiate its related state (General Purpose Registers) and allocate a fake stack which will be used during the execution of the function. Then, we have to synchronise QBDI's context with the current one — that is, put the value of the real CPU registers into those QBDI will work with. We can now decide upon what parts of the code to instrument. We can either explicitly define an arbitrary address range or ask the DBI to instrument the whole address space of the module the function address is located in. For convenience's sake, we will go for the latter in this example.
Callback function setting up
We have to specify the sort of callback function we want. Here, we would like to trace every single instruction that has been executed so I'm placing a pre-instruction code callback. It means that my function will be called before each executed instruction which lies in my targeted module.
In addition, we can also add a couple of event callback functions to be notified whenever the execution is transferred to or returned back from a part of the code that isn't instrumented by QBDI. It's quite useful when the code interacts with some other modules such as system libraries (libc.so, libart.so, libbinder.so, etc.). Note that depending on what you want to monitor, several other callback types may be pretty helpful.
Function call
We're now ready to call the targeted function through QBDI. Of course, we need to pass the expected arguments which are in our case, a pointer to a JavaVM object and a null pointer. Afterwards, we can retrieve the return value according to the used calling convention, either on a specific QBDI register or on the virtual stack. This value has to be forwarded and returned from the native replacement function we have written before. Otherwise, the application will be likely to stop running due to an unsatisfied check on the JNI version which is supposed to be returned by JNI_OnLoad().
We can optionally restore the genuine CPU context with the QBDI's one.
const qbdi = require("/path/to/frida-qbdi");
qbdi.import();

function qbdiExec(ctx, funcPtr, funcSym, args, postSync) {
    var vm = new QBDI(); // create a QBDI VM
    var state = vm.getGPRState();
    state.synchronizeContext(ctx, SyncDirection.FRIDA_TO_QBDI); // set up QBDI's context
    var stack = vm.allocateVirtualStack(state, 0x10000); // allocate a virtual stack

    vm.addInstrumentedModuleFromAddr(funcPtr);

    var icbk = vm.newInstCallback(function (vm, gpr, fpr, data) {
        var inst = vm.getInstAnalysis();
        console.log("0x" + inst.address.toString(16) + " " + inst.disassembly);
        return VMAction.CONTINUE;
    });
    var iid = vm.addCodeCB(InstPosition.PREINST, icbk); // register pre-instruction callback

    var vcbk = vm.newVMCallback(function (vm, evt, gpr, fpr, data) {
        const module = Process.getModuleByAddress(evt.basicBlockStart);
        const offset = ptr(evt.basicBlockStart - module.base);
        if (evt.event & VMEvent.EXEC_TRANSFER_CALL) {
            console.warn(" -> transfer call to 0x" + evt.basicBlockStart.toString(16) + " (" + module.name + "@" + offset + ")");
        }
        if (evt.event & VMEvent.EXEC_TRANSFER_RETURN) {
            console.warn(" <- transfer return from 0x" + evt.basicBlockStart.toString(16) + " (" + module.name + "@" + offset + ")");
        }
        return VMAction.CONTINUE;
    });
    var vid = vm.addVMEventCB(VMEvent.EXEC_TRANSFER_CALL, vcbk); // register transfer callback
    var vid2 = vm.addVMEventCB(VMEvent.EXEC_TRANSFER_RETURN, vcbk); // register return callback

    const javavm = ptr(args[0]);
    const reserved = ptr(args[1]);

    console.log("[+] Executing " + funcSym + "(" + javavm + ", " + reserved + ") through QBDI...");
    vm.call(funcPtr, [javavm, reserved]);
    var retVal = state.getRegister(0); // x86 so return value is stored on $eax
    console.log("[+] " + funcSym + "() returned " + retVal);
    if (postSync) {
        state.synchronizeContext(ctx, SyncDirection.QBDI_TO_FRIDA);
    }
    return retVal;
}
Ultimately, this script has to be compiled with frida-compile in order to properly include the frida-qbdi.js which contains the QBDI bindings. The compilation procedure is fully described in the official documentation page [11].
Demonstration
Generating a coverage file
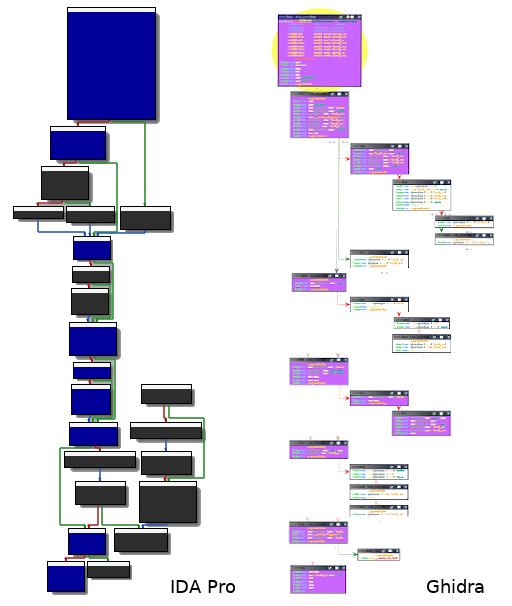
Having a trace containing all the instructions that have been executed is valuable but not really convenient as it is for reverse engineering purposes. Indeed, it's quite unclear to distinguish at a glance what paths have been taken throughout the execution. In order to properly render the captured trace, an integration in a disassembler may be a great idea. That way, one could accurately visualise which basic blocks have been passed through. Nevertheless, most of the disassemblers don't natively provide an option for doing so — luckily for us, various plugins do. In this example, we are using Lighthouse [12] and Dragondance [13], for respectively IDA Pro and Ghidra. These plugins can be easily configured by importing a code coverage file in the drcov format [14]. This format is used by DynamioRIO [15] for storing information about code coverage.
The drcov format is pretty straightforward: besides header fields (version and flavour), a module table describing the process' memory layout must be specified. A unique ID is assigned to each module. Right afterwards, there is what is called the basic block table. This table contains every basic block that has been hit during the execution. A basic block is defined by three properties: its start (relative) address, its size and the ID of the module it belongs to.
Since we are able to place a callback at the beginning of every basic block, we can determine these values, thus generate our own file. Instead of working at the instruction scale, we now need to retrieve the base address and the size of all the executed basic blocks. In practice, we have to define a QBDI event callback function of type BASIC_BLOCK_NEW [16], responsible for gathering such information. Our function will be called whenever QBDI is about to execute a new basic block, unknown so far. In this case, we don't solely want to print some interesting values about this basic block but create a code coverage file which can be imported in a disassembler later on. However, within a Frida script's context, we're not able to manipulate files. As a result, we must stop using the frida command line utility and run our JS script straight from an underlying Python script, relying on the messaging system Frida offers [17]. Doing so allows us to communicate between the JS and Python sides and then perform all actions on the filesystem we need.
var vcbk = vm.newVMCallback(function (vm, evt, gpr, fpr, data) {
    const module = Process.getModuleByAddress(evt.basicBlockStart);
    const base_addr = ptr(evt.basicBlockStart - module.base); // address must be relative to the module's start
    const size = evt.basicBlockEnd - evt.basicBlockStart;
    send({"bb": 1}, getBBInfo(base_addr, size, module)); // send the newly discovered basic block to the Python side
    return VMAction.CONTINUE;
});
var vid = vm.addVMEventCB(VMEvent.BASIC_BLOCK_NEW, vcbk);
Note that the getBBInfo() function only serialises information about the basic block before sending the message over. Obviously, the Python side has to handle this kind of message, keep execution-related content in memory and finally generate a code coverage file accordingly, in the proper format described above. If everything goes well, the output file can be loaded in either IDA Pro or Ghidra thanks to their corresponding code coverage plugins. All the executed basic blocks will be highlighted — it's now much clearer for us to follow the execution flow and focus only on relevant parts of the code.
Conclusion
The easiness of Java/Kotlin reverse engineering encourages Android application developers to rather implement sensitive procedures in C/C++. As a result, reverse engineers' work usually gets painful. Using QBDI alongside Frida turns out to be quite a good option in particular when it comes to looking into those native functions. This combination indeed offers a way to figure out what a function is doing at different levels: function, basic block and instruction scale. Moreover, one could take advantage of QBDI's execution transfer events to resolve external calls to system libraries or keep track of memory accesses and then get the big picture of the execution. To efficiently assist reverse engineers, gathered information can be wisely integrated in some existing reverse-engineering-oriented tools for refining their static analysis. Besides generating a visual representation of the execution flow, getting such feedbacks from runtime is valuable for other security-related purposes such as fuzzing. It's also worth noting that if performances matter, Frida and QBDI both provide C/C++ APIs.
Acknowlegments
Thanks to my colleagues for proofreading this article.
References
| [1] | https://docs.oracle.com/javase/8/docs/technotes/guides/jni/index.html |
| [2] | https://frida.re/ |
| [3] | https://passthesalt.ubicast.tv/videos/2020-why-are-frida-and-qbdi-a-great-blend-on-android/ |
| [4] | https://2020.pass-the-salt.org/files/slides/PTS2020-Talk-05-Frida_QBDI.pdf |
| [5] | https://github.com/QBDI/QBDI |
| [6] | https://qbdi.quarkslab.com/#download |
| [7] | https://github.com/QBDI/QBDI/blob/master/tools/frida-qbdi.js |
| [8] | https://docs.oracle.com/javase/8/docs/technotes/guides/jni/spec/invocation.html#JNJI_OnLoad |
| [9] | https://docs.oracle.com/javase/8/docs/technotes/guides/jni/spec/functions.html |
| [10] | https://play.google.com/store/apps/details?id=com.whatsapp |
| [11] | https://qbdi.readthedocs.io/en/stable/frida_intro.html |
| [12] | https://github.com/gaasedelen/lighthouse |
| [13] | https://github.com/0ffffffffh/dragondance |
| [14] | https://www.ayrx.me/drcov-file-format |
| [15] | https://dynamorio.org/ |
| [16] | https://qbdi.readthedocs.io/en/stable/frida_bindings.html#BASIC_BLOCK_NEW |
| [17] | https://frida.re/docs/messages/ |