Author Benoît Forgette
Category Kernel Debugging
Tags kernel, debugging, Linux, 2024
Techniques for analyzing binaries or kernel modules that may try to monitor themselves, similar to malware behavior. To avoid detection during analysis, one approach is to use an hypervisor like QEMU to conduct research within a virtualized environment. Although the target may realize it is running in a virtual machine, this usually does not trigger suspicion, as hypervisors are common in modern environments. This method allows for detailed analysis while maintaining stealth, making it effective in scenarios where the target must not detect the monitoring.
Introduction
When analyzing certain binaries or kernel modules, some targets may attempt to monitor themselves, similarly to how malware behave. To prevent the target from detecting that it is under analysis, it’s essential to be creative in how we conduct our research.
One effective approach is to use a hypervisor like QEMU to instrument all the actions we wish to perform from within the virtualized environment. While it’s possible that the target could identify it’s running in a virtual machine, this is not necessarily an issue. In modern environments, running a Linux server on a hypervisor is quite common, and for most of the targets we analyze, this will not raise any red flags.
By leveraging this method, you can perform in-depth analysis without the target becoming aware of the monitoring, making it a powerful tool in situations where stealth is required.
The current foundation
The kernel debugger kgdb, hypervisors like QEMU or JTAG-based hardware interfaces allow to debug the Linux kernel and its modules during runtime using GDB. GDB comes with a powerful scripting interface for Python. The kernel provides a collection of helper scripts that can simplify typical kernel debugging steps.
These scripts have been available since commit 3ee7b3fa2cd0182628cca8d9bb5ce2d4722e8dc5, which corresponds to Linux 4.0-rc1.
This solution enables you to:
- Monitor syscalls;
- List running processes;
- List kernel modules;
- Debug userland processes;
- Debug kernel modules;
- Start new processes.
This is a short tutorial about how to enable and use them. It focuses on QEMU/KVM virtual machines as target, but the examples can be transferred to the other GDB stubs as well.
To use this setup, you will need a special kernel version. Although, as discussed in this article, it is theoretically possible to replicate similar behavior with a regular kernel, we do not advise it as it will cause you some pain and possible latency problems.
In practice, you will need to identify the kernel version and configuration used, in order to recompile a corresponding kernel with the necessary debug symbols. For this example, we will recompile a Linux kernel with the appropriate options.
However, keep in you mind that many distributions provide precompiled kernels with debug symbols. For instance:
- On Debian, you can install the package
linux-image-<version>-<arch>-dbg; - On Red Hat, you can use the
kernel-debuginfopackage.
If this option is available to you, this is the preferred way. Now, let's get back to our point..
When compiling the kernel, ensure the following options are enabled:
- DEBUG_INFO (to include debugging information);
- GDB_SCRIPT (for GDB integration).
Once the kernel is compiled, use the newly built kernel. To keep discretion launch your VM with the kernel without symbols and keep the version with symbols on your host machine.
Finally, just to simplify our explanation we will disable Kernel Address Space Layout Randomization (KASLR). You can edit your GRUB configuration file or pass it directly on command line as follows:
qemu-system-x86_64 \
  -kernel ./vmlinuz-6.9.12-amd64 \
  -nographic \
  -append "root=/dev/vda1 console=ttyS0 nokaslr" \
  -initrd ./initrd.img-6.9.12-amd64 \
  -drive file=./disk_image.qcow2,if=virtio,format=qcow2
  --enable-kvm \
  -cpu host \
  -s -S
To use the GDB scripts provided by the Linux Kernel Development Team, you will need to:
- Obtain the compiled vmlinux binary (this file contains the uncompressed kernel with symbols);
- Execute the command
make scripts_gdbfrom where you have compiled your linux kernel (this is required for kernels version 5.1 and above).
To enable the GDB stub in QEMU/KVM, start the virtual machine with the -s option added to the command line. This opens a GDB debugging port, allowing you to connect GDB and use the provided scripts to monitor and control the kernel or userland processes running inside the virtual machine.
Enable the Gdb stub of QEMU/KVM, either at VM startup time by appending "-s" to the QEMU command line to ~/.gdbinit allow execution of gdbscript from /path/to/linux-build
set auto-load safe-path /path/to/linux-build
Then move to /path/to/linux-build
cd /path/to/linux-build
Start GDB:
gdb vmlinux
Attach to the booted guest:
(gdb) target remote :1234
You have access to the full range of commands, which will be briefly introduced below:
- lx-cpus, Display the known state of each CPU based on the kernel masks and can help identify the state of hotplugged CPUs;
- lx-device-list-bus, Print devices on a bus (or all buses if not specified);
- lx-dmesg, Print Linux kernel log buffer;
- lx-genpd-summary, Print genpd summary, output is similar to /sys/kernel/debug/pm_genpd/pm_genpd_summary;
- lx-interruptlist, Print /proc/interrupts;
- lx-list-check, Verify a list consistency;
- lx-pfn_to_page, PFN to struct page;
- lx-page_to_pfn, Struct page to PFN;
- lx-page_address, Struct page to linear mapping address;
- lx-page_to_phys, Struct page to physical address;
- lx-virt_to_phys, Virtual address to physical address;
- lx-virt_to_page, Virtual address to struct page;
- lx-sym_to_pfn, Symbol address to PFN;
- lx-pfn_to_kaddr, PFN to kernel address;
- lx-lsmod, List currently loaded modules;
- lx-getmod-by-textaddr, Look up loaded kernel module by text address;
- lx-dump-page-owner, Dump page owner;
- translate-vm, Print the entire paging structure used to translate a given virtual address. Having an address space of the currently executed process translates the virtual address and prints detailed information of all paging structure levels used for the translation. Currently supported arch: x86;
- lx-cmdline, Report the Linux Commandline used in the current kernel. Equivalent to
cat /proc/cmdlineon a running target; - lx-version, Report the Linux Version of the current kernel. Equivalent to
cat /proc/versionon a running target; - lx-iomem, Identify the IO memory resource locations defined by the kernel. Equivalent to
cat /proc/iomemon a running target; - lx-ioports, Identify the IO port resource locations defined by the kernel. Equivalent to
cat /proc/ioportson a running target; - lx-mounts, Report the VFS mounts of the current process namespace. Equivalent to
cat /proc/mountson a running target. An integer value can be supplied to display the mount values of that process namespace; - lx-fdtdump, Output Flattened Device Tree header and dump FDT blob to the filename specified as the command argument. Equivalent to
cat /proc/fdt > fdtdump.dtbon a running target; - lx-slabtrace, Show specific cache slabtrace;
- lx-slabinfo, Show slabinfo;
- lx-symbols, (Re-)load symbols of Linux kernel and currently loaded modules. The kernel (vmlinux) is taken from the current working directly. Modules (.ko) are scanned recursively, starting in the same directory. Optionally, the module search path can be extended by a space separated list of paths passed to the lx-symbols command;
- lx-ps, Dump Linux tasks;
- lx-timerlist, Print /proc/timer_list;
- lx-vmallocinfo, Show vmallocinfo;
What is possible to do with it
The main use case presented here involves debugging a third-party kernel module. The key actions we aim to achieve are:
- Monitoring specific syscalls;
- Setting breakpoints within the address range of the module being debugged;
- Adding callbacks to specific functions in the module without interrupting the execution flow.
To accomplish this, we will use the APIs behind the exposed GDB commands. The first step is to obtain the base address of the kernel module. To do this, we can use the function linux.modules.find_module_by_name, which returns a module object containing the base address. You can retrieve it as follows:
import linux
cfg80211 = linux.modules.find_module_by_name("cfg80211")
text = cfg80211['mem'][constants.LX_MOD_TEXT]
base_addr_module = text['base']
This address corresponds to the start of the .text segment loaded into memory. In our example, we will analyze a WiFi driver from a target previously studied during Pwn2Own.
In this case, the base address is 0x10fc0, as shown in the following screenshot:
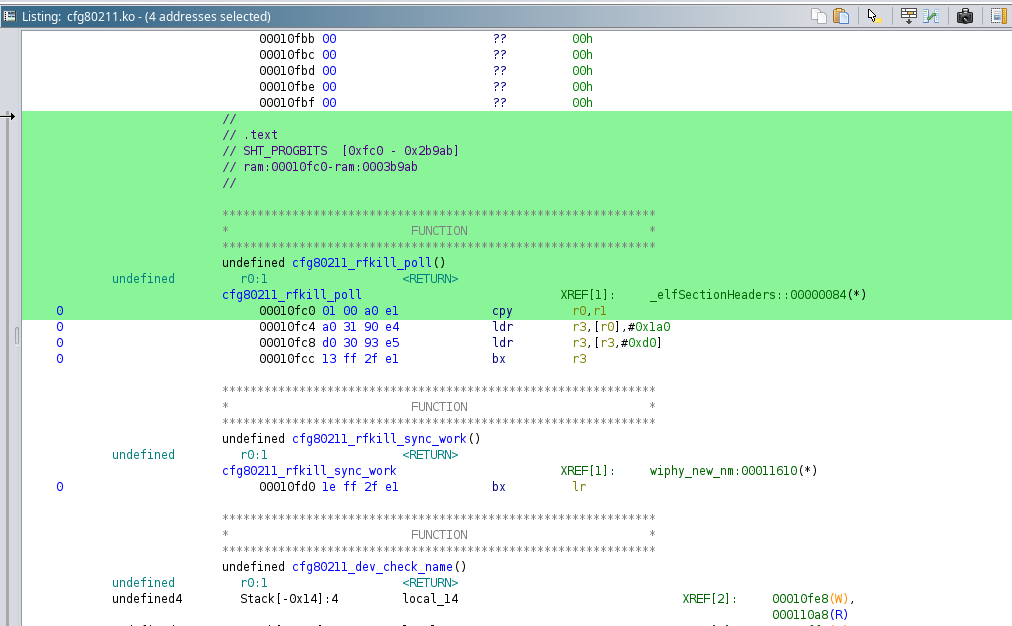
To set a breakpoint in this module, you simply need to calculate the following:
With access to all kernel symbols, it’s also possible to set a breakpoint on a specific syscall of interest,
filtering by PID using a particular field ($lx_current()), which returns the current task. You can then access the process name or its PID using the fields $lx_current().comm and $lx_current().pid, respectively.
While all these actions could be performed manually, this would be tedious and slow. To streamline the process, you can use breakpoints with callbacks, which will automatically detect if the desired process is being executed and perform a specific action accordingly.
Example: Monitoring the execve Syscall
To illustrate, let us monitor the execve syscall and display the process name each time the target process attempts to execute another binary. To do this, we first locate the definition file of all syscall callbacks (syscalls.h), where we find the sys_execve syscall. The first argument of this syscall is the name of the file being executed, which we can use to capture the necessary information.
By combining breakpoints and callbacks, we can efficiently monitor the behavior of the target process and track any execution attempts with execve.
class BP_execve(gdb.Breakpoint):
   def stop(self):
      cur_pid = gdb.parse_and_eval("$lx_current().pid")
         if cur_pid == 1234:
            print(gdb.parse_and_eval("filename"))
         return False

BP_execve("sys_execve")
The code above will be triggered every time execve is called. It will check whether the current PID matches the target PID (1234), and if it does, it will display the name of the binary that the target process is attempting to execute.
Similarly, we can apply the same logic to our kernel module. Let’s begin with an example: this example displays the control frames before they are transmitted via the Netlink channel. Using the same approach, it would also be possible to modify these frames.
packet=0
size=0

class BP_print_hook(gdb.Breakpoint):
    def stop(self):
        global packet
        global size
        top = gdb.newest_frame()
        packet = top.read_register('r2')
        size = top.read_register('r3')


class BP_print_hook2(gdb.Breakpoint):
    def stop(self):
      global packet
      global size
      content = bytes(inferior.read_memory(packet, size))
      print(content)


import linux
cfg80211 = linux.modules.find_module_by_name("cfg80211")
text = cfg80211['mem'][constants.LX_MOD_TEXT]
base_addr_module = text['base']

hook_offset = base_addr_module+0x2ddbc-0x10fc0
hook_offset_2 = base_addr_module+0x2ddc0-0x10fc0

BP_print_hook(f"*{hook_offset}")
BP_print_hook2(f"*{hook_offset_2}")
Below is a sample method for receiving control frames:
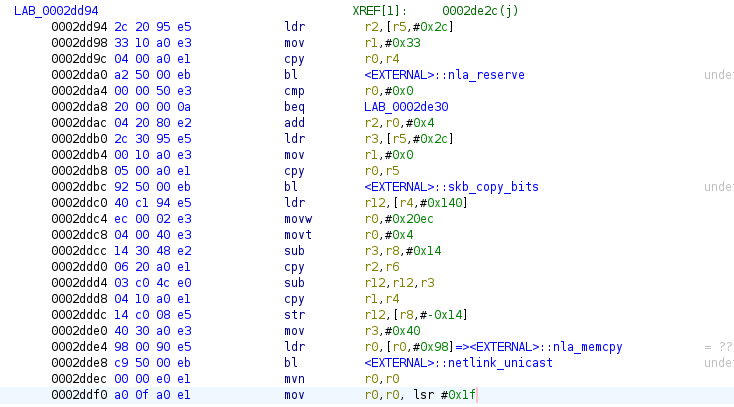
To effectively monitor the control frame data, you can set two breakpoints around
the skb_copy_bits function.
The first breakpoint is placed before the function call to capture the address and size of the buffer.
The second breakpoint is placed after the function call to display this information.
Porting the debug script to kernel 3.10
These capabilities are a powerful tool to analyze various targets relatively stealthly, as long as they can be run in a virtual machine. However, as mentioned earlier in the blog post, these features were introduced in Linux version 4.0-rc1. Some programs, however, are working for or exhibit different behaviors on older kernel versions.
Therefore, we need to adapt these scripts for older kernel versions, which is the focus of the rest if the blog post.
The following steps are specifically tailored for kernel 3.10 and may need adjustments for different versions.
We will concentrate on the following functionalities:
- lx-ps, Dump Linux tasks;
- lx-lsmod, List currently loaded modules.
This should enable us to debug all types of targets using these two functionalities.
We will start by minimizing our requirements in the vmlinux-gdb.py file:
import struct
import os

sys.path.insert(0, os.path.dirname(os.path.abspath(__file__)))

try:
    gdb.parse_and_eval("0")
    gdb.execute("", to_string=True)
except:
    gdb.write("NOTE: gdb 7.2 or later required for Linux helper scripts to "
              "work.\n")
else:
     import linux.utils
     import linux.lists
     import linux.modules
     import linux.tasks
We will only need the modules and tasks, but these two modules have dependencies on utils and lists, which we will also retain. We determined that utils, lists, and tasks do not require modifications and can be used as is. This is fortunate, and now we need to examine the changes in kernel versions related to kernel modules since version 3.10.
One element not found in the script is part of the struct module.
We should review the definition of struct module in the /include/linux/module.h
file of the Linux kernel.
In version 6.11, it looks like this:
struct module {
    enum module_state state;

    /* Member of list of modules */
    struct list_head list;

    /* Unique handle for this module */
    char name[MODULE_NAME_LEN];

#ifdef CONFIG_STACKTRACE_BUILD_ID
    /* Module build ID */
    unsigned char build_id[BUILD_ID_SIZE_MAX];
#endif

    /* Sysfs stuff. */
    struct module_kobject mkobj;
    struct module_attribute *modinfo_attrs;
    const char *version;
    const char *srcversion;
    struct kobject *holders_dir;

    /* Exported symbols */
    const struct kernel_symbol *syms;
    const s32 *crcs;
    unsigned int num_syms;

#ifdef CONFIG_ARCH_USES_CFI_TRAPS
    s32 *kcfi_traps;
    s32 *kcfi_traps_end;
#endif

    /* Kernel parameters. */
#ifdef CONFIG_SYSFS
    struct mutex param_lock;
#endif
    struct kernel_param *kp;
    unsigned int num_kp;

    /* GPL-only exported symbols. */
    unsigned int num_gpl_syms;
    const struct kernel_symbol *gpl_syms;
    const s32 *gpl_crcs;
    bool using_gplonly_symbols;

#ifdef CONFIG_MODULE_SIG
    /* Signature was verified. */
    bool sig_ok;
#endif

    bool async_probe_requested;

    /* Exception table */
    unsigned int num_exentries;
    struct exception_table_entry *extable;

    /* Startup function. */
    int (*init)(void);

    struct module_memory mem[MOD_MEM_NUM_TYPES] __module_memory_align;

   ...
} ____cacheline_aligned __randomize_layout;
and in version 3.10:
struct module
{
    enum module_state state;

    /* Member of list of modules */
    struct list_head list;

    /* Unique handle for this module */
    char name[MODULE_NAME_LEN];

    /* Sysfs stuff. */
    struct module_kobject mkobj;
    struct module_attribute *modinfo_attrs;
    const char *version;
    const char *srcversion;
    struct kobject *holders_dir;

    /* Exported symbols */
    const struct kernel_symbol *syms;
    const unsigned long *crcs;
    unsigned int num_syms;

    /* Kernel parameters. */
    struct kernel_param *kp;
    unsigned int num_kp;

    /* GPL-only exported symbols. */
    unsigned int num_gpl_syms;
    const struct kernel_symbol *gpl_syms;
    const unsigned long *gpl_crcs;

#ifdef CONFIG_UNUSED_SYMBOLS
    /* unused exported symbols. */
    const struct kernel_symbol *unused_syms;
    const unsigned long *unused_crcs;
    unsigned int num_unused_syms;

    /* GPL-only, unused exported symbols. */
    unsigned int num_unused_gpl_syms;
    const struct kernel_symbol *unused_gpl_syms;
    const unsigned long *unused_gpl_crcs;
#endif

#ifdef CONFIG_MODULE_SIG
    /* Signature was verified. */
    bool sig_ok;
#endif

    /* symbols that will be GPL-only in the near future. */
    const struct kernel_symbol *gpl_future_syms;
    const unsigned long *gpl_future_crcs;
    unsigned int num_gpl_future_syms;

    /* Exception table */
    unsigned int num_exentries;
    struct exception_table_entry *extable;

    /* Startup function. */
    int (*init)(void);

    /* If this is non-NULL, vfree after init() returns */
    void *module_init;

    /* Here is the actual code + data, vfree'd on unload. */
    void *module_core;

    /* Here are the sizes of the init and core sections */
    unsigned int init_size, core_size;

    /* The size of the executable code in each section.  */
    unsigned int init_text_size, core_text_size;

    /* Size of RO sections of the module (text+rodata) */
    unsigned int init_ro_size, core_ro_size;

...
};
In version 3.10, struct module_memory mem[MOD_MEM_NUM_TYPES] did not exist.
This structure contains the base address and the size of the modules,
We see that all this information was directly stored in the main structure and not in this other structure
module_memory, we can redevelop the function lsmod and so get the base address of
kernel module on version 3.10.
import gdb

from linux import cpus, utils, lists


module_type = utils.CachedType("struct module")


def module_list():
    global module_type
    modules = utils.gdb_eval_or_none("modules")
    if modules is None:
        return

    module_ptr_type = module_type.get_type().pointer()

    for module in lists.list_for_each_entry(modules, module_ptr_type, "list"):
        yield module


def find_module_by_name(name):
    for module in module_list():
        if module['name'].string() == name:
            return module
    return None


class LxModule(gdb.Function):
    """Find module by name and return the module variable.

$lx_module("MODULE"): Given the name MODULE, iterate over all loaded modules
of the target and return that module variable which MODULE matches."""

    def __init__(self):
        super(LxModule, self).__init__("lx_module")

    def invoke(self, mod_name):
        mod_name = mod_name.string()
        module = find_module_by_name(mod_name)
        if module:
            return module.dereference()
        else:
            raise gdb.GdbError("Unable to find MODULE " + mod_name)


LxModule()


class LxLsmod(gdb.Command):
    """List currently loaded modules."""

    _module_use_type = utils.CachedType("struct module_use")

    def __init__(self):
        super(LxLsmod, self).__init__("lx-lsmod", gdb.COMMAND_DATA)

    def invoke(self, arg, from_tty):
        gdb.write(
            "Address{0}    Module                  Size  Used by\n".format(
                "        " if utils.get_long_type().sizeof == 8 else ""))

        for module in module_list():
            total_size = module['init_size'] + module['core_size'] + \
                    module['init_text_size'] + \
                    module['core_text_size'] + \
                    module['init_ro_size'] + \
                    module['core_ro_size']
            gdb.write("{address} {name:<19} {size:>8}".format(
                address=module['module_core'],
                name=module['name'].string(),
                size=hex(total_size)))#,
            gdb.write("\n")
LxLsmod()

def help():
    t = """Usage: lx-getmod-by-textaddr [Hexadecimal Address]
    Example: lx-getmod-by-textaddr 0xffff800002d305ac\n"""
    gdb.write("Unrecognized command\n")
    raise gdb.GdbError(t)
With this simple modification, we can achieve capabilities similar to those available on more recent Linux versions:
- Monitor specific syscalls.
- Set breakpoints within the address range of the module being debugged.
- Put callbacks on certain functions of the module without interrupting the execution flow.
These adaptations can be applied to most commands defined in the gdbscripts. By comparing older and newer kernel versions, you can adapt the debugging tools accordingly, which also provides deeper insights into the workings of the Linux kernel.
This approach not only helps in maintaining compatibility with older kernel versions but also enriches your understanding of kernel internals and how they evolve over time.