Author Carlo Ramponi
Category Reverse-Engineering
Tags reverse-engineering, fuzzing, embedded-device, IoT, 2023
This blog post presents an overview of Starlink's User Terminal runtime internals, focusing on the communications that happen within the device and with user applications and some tools that can help further research on the same topic.
Introduction
Starlink is a satellite-based Internet access service provided by Space X. This service already counts more than 1.5 million subscribers all around the world, using the very same infrastructure. Starlink relies on 3 components:
- A user terminal, which communicates with the satellites, and on which most of the current research is focused.
- A satellite fleet acting as a mesh network.
- A gateway that connects the satellites to the internet.
Numerous studies [1, 2, 3] have already been conducted on the subject, mainly on the user terminal. During my 6-month internship at Quarkslab as part of my Master's degree program at the University of Trento, I carried out the analysis of Starlink by reverse-engineering its firmware and the various protocols it uses. At the end of the internship, I gained a good knowledge of how the device works internally and developed a set of tools that could help other researchers working on the same topic. These tools will be described and published along with this blog post.
To conduct this study, we analyzed two regular User Terminals version 2 (the round one) and a User Terminal version 3 (the squared one) with root access (researcher access) which was provided by SpaceX's security team toward the end of my internship.
Firmware overview
The first step was to dump the firmware of the device since it's not publicly available, and we did that thanks to a blog post by the COSIC research group at KU Leuven. Once we got the firmware, we started inspecting the content, trying to understand how the memory was structured. We also started looking into the U-Boot version that was customized by SpaceX, and it is being used as the final bootloader stage (BL33) for the User Terminal. The U-Boot license requires any modification of its code to be published with the same license, hence you can find it on GitHub.
From the file include/configs/spacex_catson_boot.h we can see how the memory is partitioned, here is a part of it:
+-----------------+ 0x0000_0000
| bootfip0 (1 MB) |
+-----------------+ 0x0010_0000
[...]
+-----------------+ 0x0060_0000
| fip  a.0 (1 MB) |
+-----------------+ 0x0070_0000
[...]
+-----------------+ 0x0100_0000
| linux a (32 MB) |
+-----------------+ 0x0300_0000
| linux b (32 MB) |
+-----------------+ 0x0500_0000
[...]
This allows us to split the image into small partitions and analyze each of them separately.
This script can help you do that automatically.
From here, we can also see that almost every partition is present multiple times (e.g. linux a/b).
This is because of the software update procedure, which will overwrite the partition that is not currently being used so that in the case of an error, there will still be the original partition that is known to be "correct".
An overview of the main partitions can be seen in the following picture.
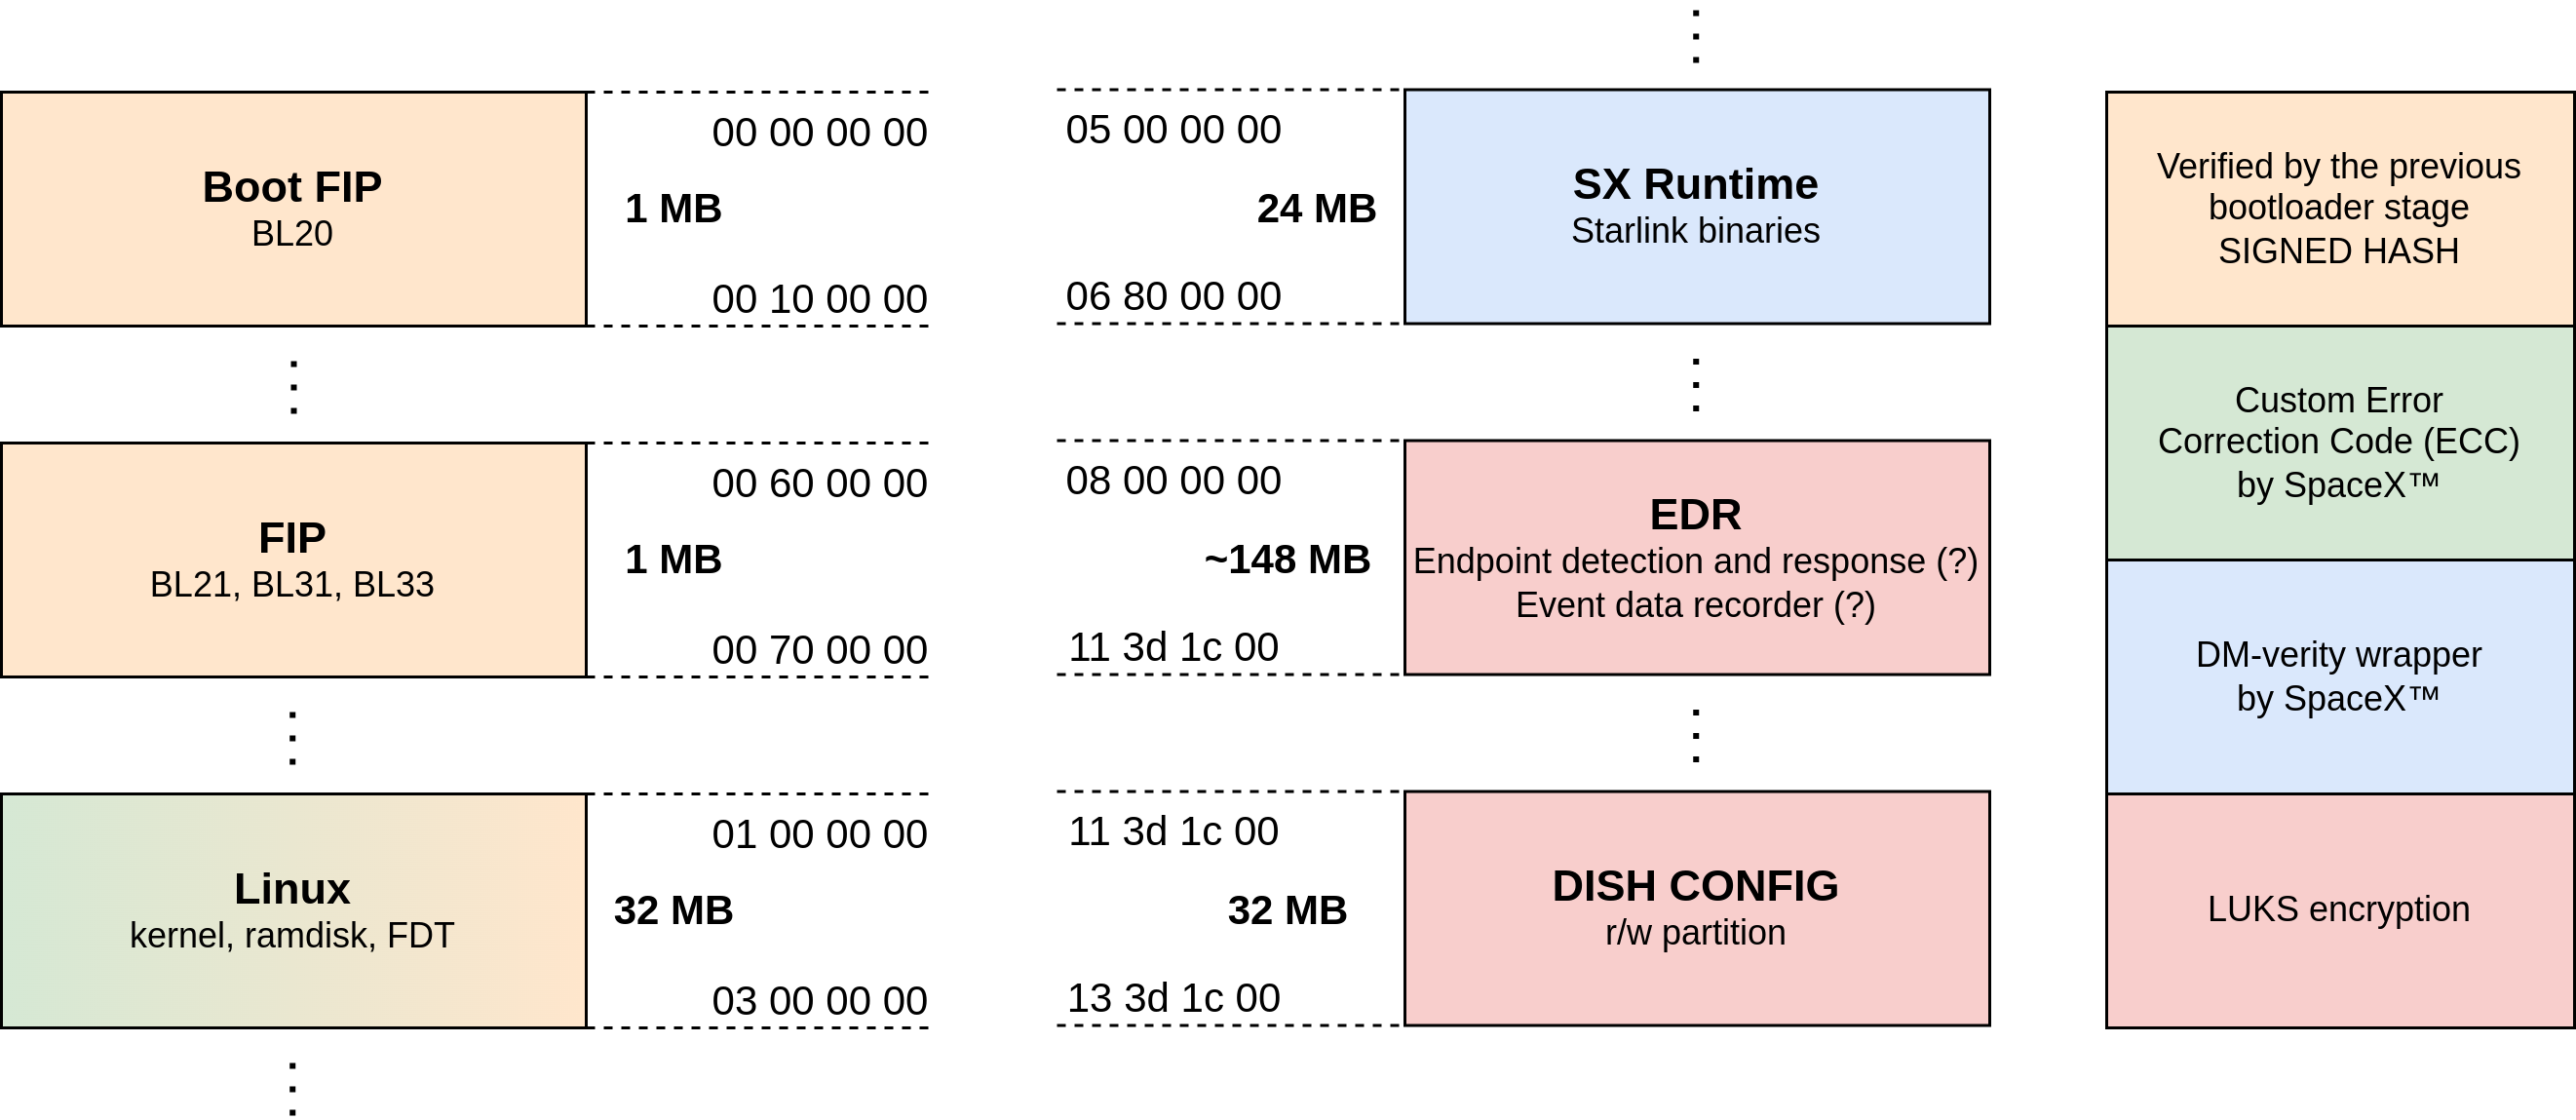
Partitions Boot FIP and FIP contain all the bootloader stages that compose the secure boot chain, most of them are based on the ARM TF-A project, which does not come with a GNU-like license, and the last one (BL33) is the U-Boot bootloader we mentioned above.
Having a clear idea of the boot process is essential to perform the fault injection attack developed by the COSIC research group. The boot chain follows the classic multi-stage secure boot implemented by ARM TF-A, in the following picture you can see an overview of it.
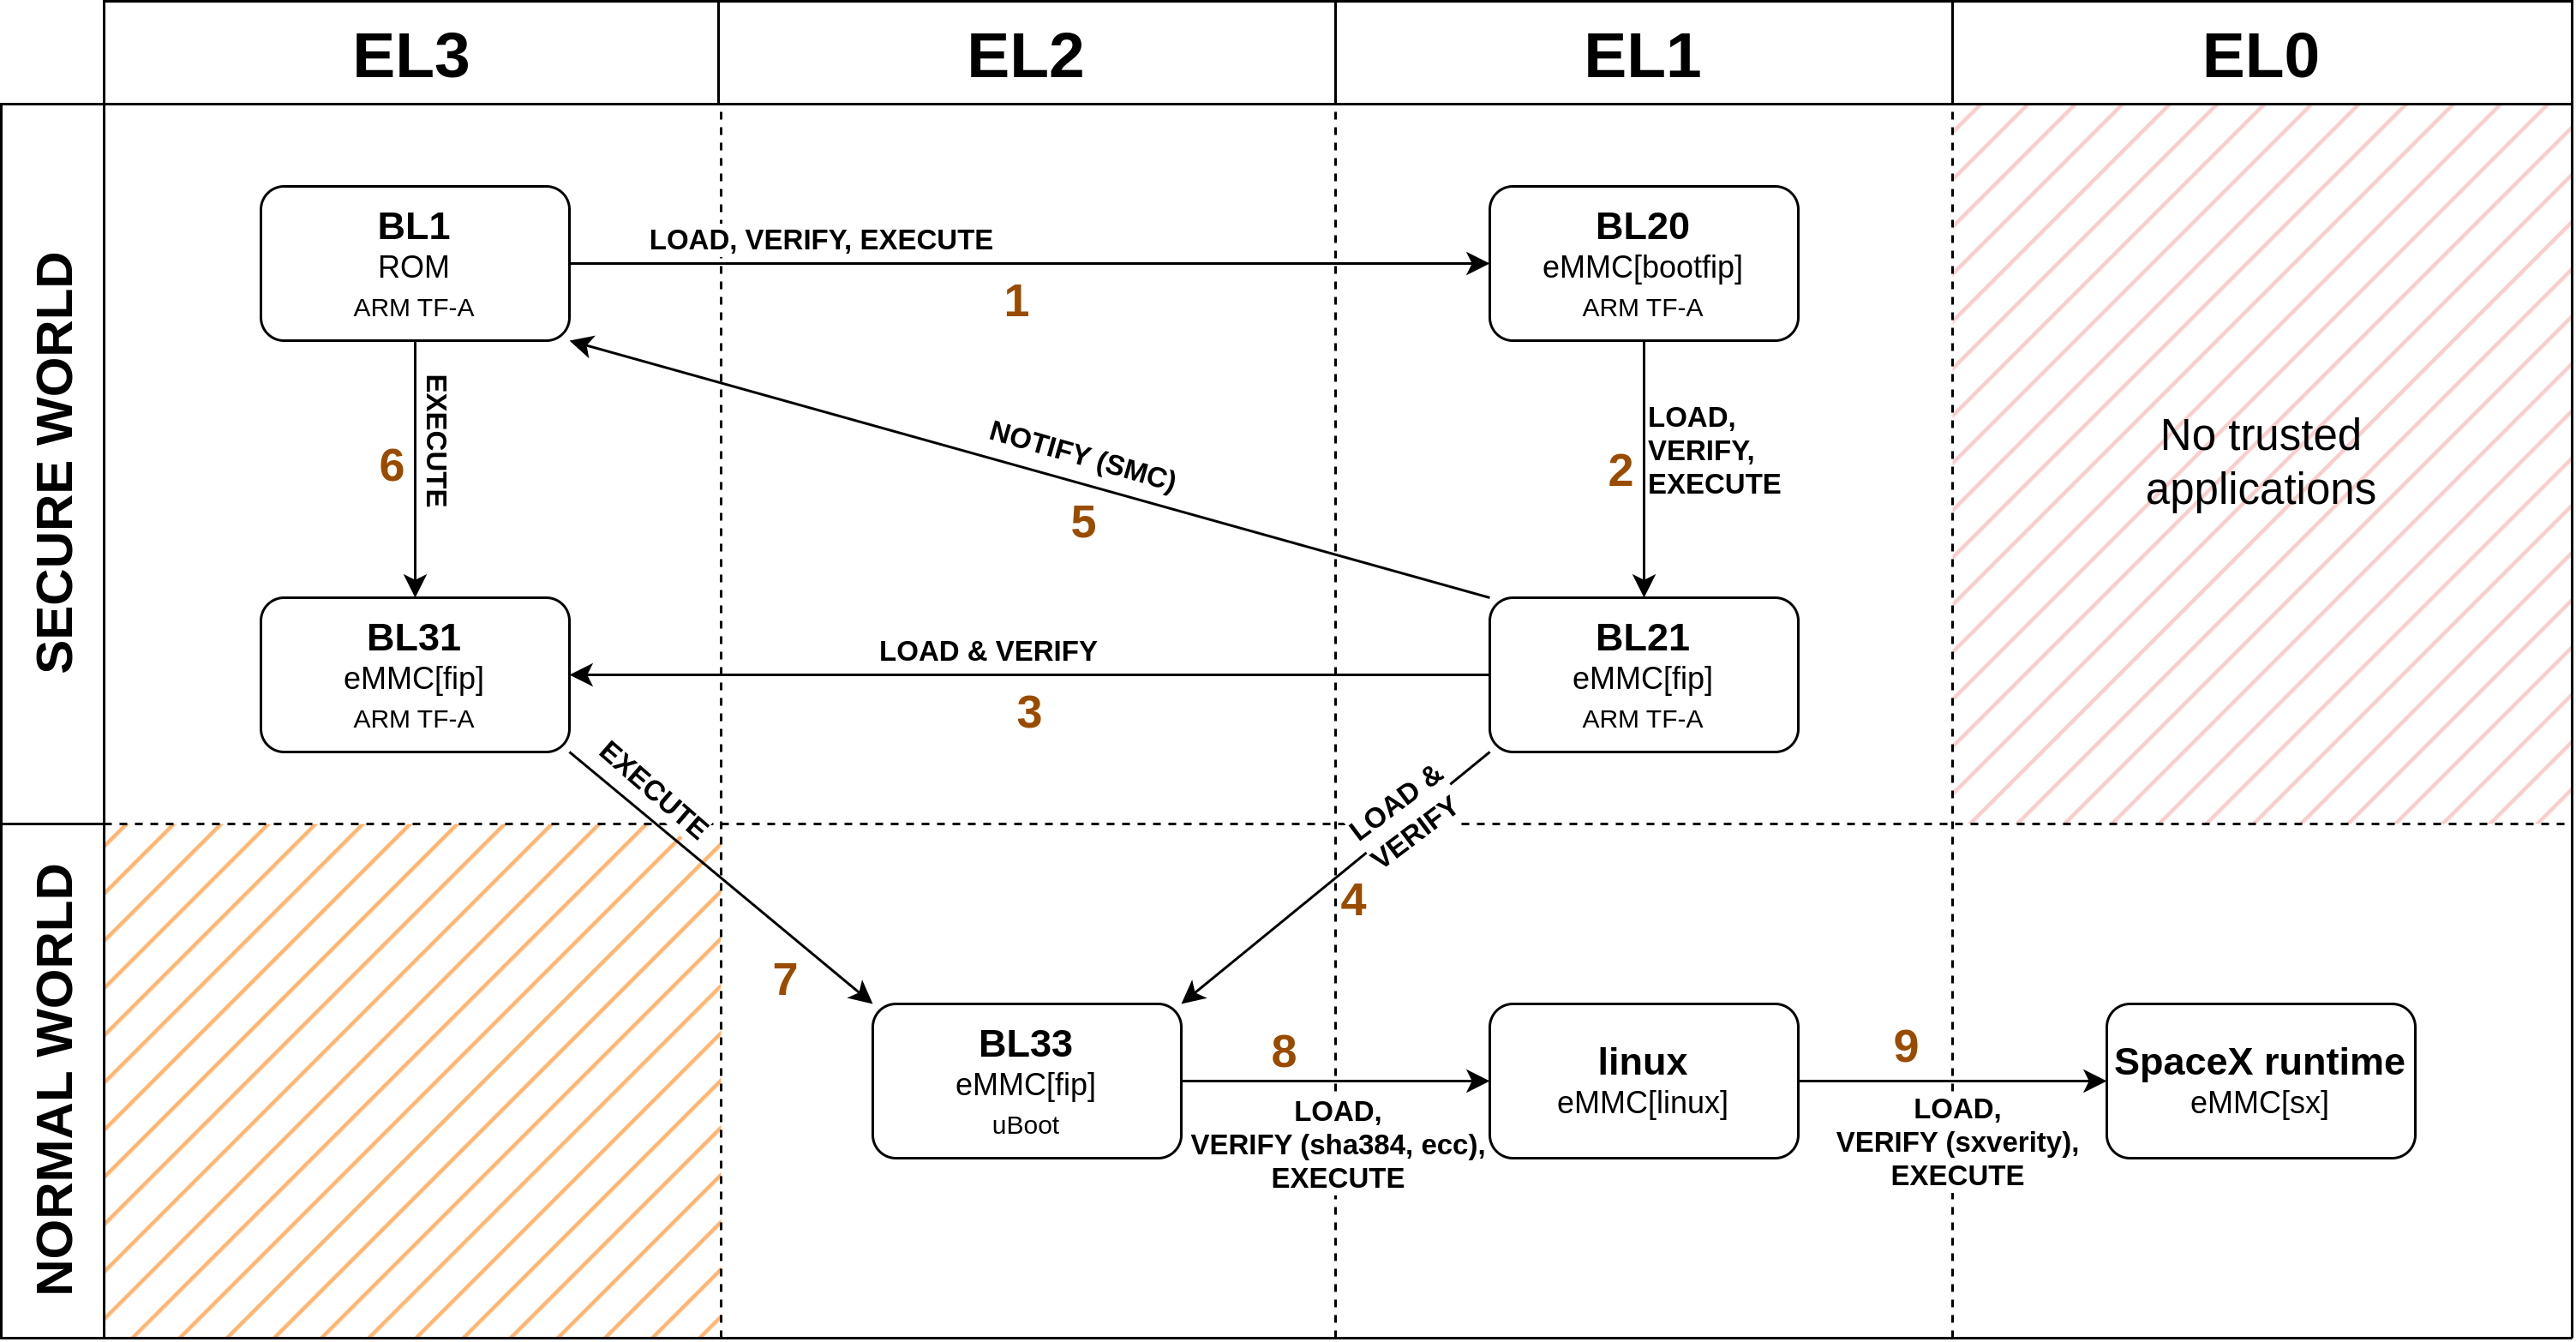
Boot stages come from different partitions of the eMMC and the first, which represents the Root of Trust, comes from an internal ROM of the main processor, they can be extracted from the partition images by using fiptool, from ARM TF-A. At the end of the boot process, BL31 will reside in Exception Level 3 (EL3) and act as a secure monitor, while the Linux kernel will run in Exception Level 1 (EL1), in the normal world running user-land applications in Exception Level 0 (EL0).
Then, the linux partition, as the name suggests, contains the Linux kernel, its ramdisk image and some Flattened Device Trees, one for every hardware version of the User Terminal.
This partition can be unpacked by using dumpimage from the U-Boot project, the ramdisk is a cpio image and FDTs come in the form of Device Tree Blobs (DTBs) which can be "decompiled" to Device Tree Sources (DTSs) text with the Device Tree Compiler.
This partition also comes with some Error Correcting Code (ECC) information in it, you will need to remove it before being able to unpack it.
The ECC mechanism is custom-made by SpaceX and you can understand how it works by looking at the code in U-Boot which handles this verification, the next Section explains how it works and provides a tool to do that.
The sx (SX Runtime) partition contains configuration files and binaries that are specific to the User Terminal.
This partition will be mounted by the Linux's init script on /sx/local/runtime and after that binaries in this volume will be started.
In this case, integrity verification is done with sxverity which is yet another custom tool by SpaceX.
The next section will explain how this works.
Other partitions include some encrypted ones, using the Linux Unified Key System (LUKS), which are the only ones with the write permission, and some other smaller partitions that are not worth mentioning.
Data integrity
As we have seen from a brief analysis of the content of the eMMC dump, SpaceX is using some custom-made mechanisms for data integrity, along with the standard ones already included in ARM TF-A and U-Boot. Here is an overview of the custom-made components.
ECC
The Error Correcting code mechanism is only used in the FIT image and only provides data integrity, without considering authenticity. This means that, in theory, you can tamper with some ECC-protected components of the dish if you provide correctly formatted data using your own implementation of the ecc procedure (or using the binary found in the ramdisk). But for the FIT image, this is not possible because authenticity is also checked by the last bootloader stage.
So this is just used to prevent errors in the eMMC storage.
This works similarly to its original ancestor, the ECC RAM, which embeds some additional data in between the actual content of the memory - originally Hamming codes - that are computed as a function of the data they are "protecting". Then, when some data is accessed, Hamming codes are recomputed and if they do not correspond to the ones saved in memory, an error occurred, and depending on how many bits have been mistakenly flipped, the error can be corrected. This version of ECC uses Reed-Solomon error correction (instead of Hamming codes) and a final hash (i.e. MD5) to check the integrity of the whole file that is being decoded.
Here you can find a simple Python script that strips out ECC information from a file, without checking the correctness of the data, that we used to be able to unpack the FIT image. Inside the ramdisk, there is a binary (unecc) that does the same thing also checking and trying to correct possible errors.
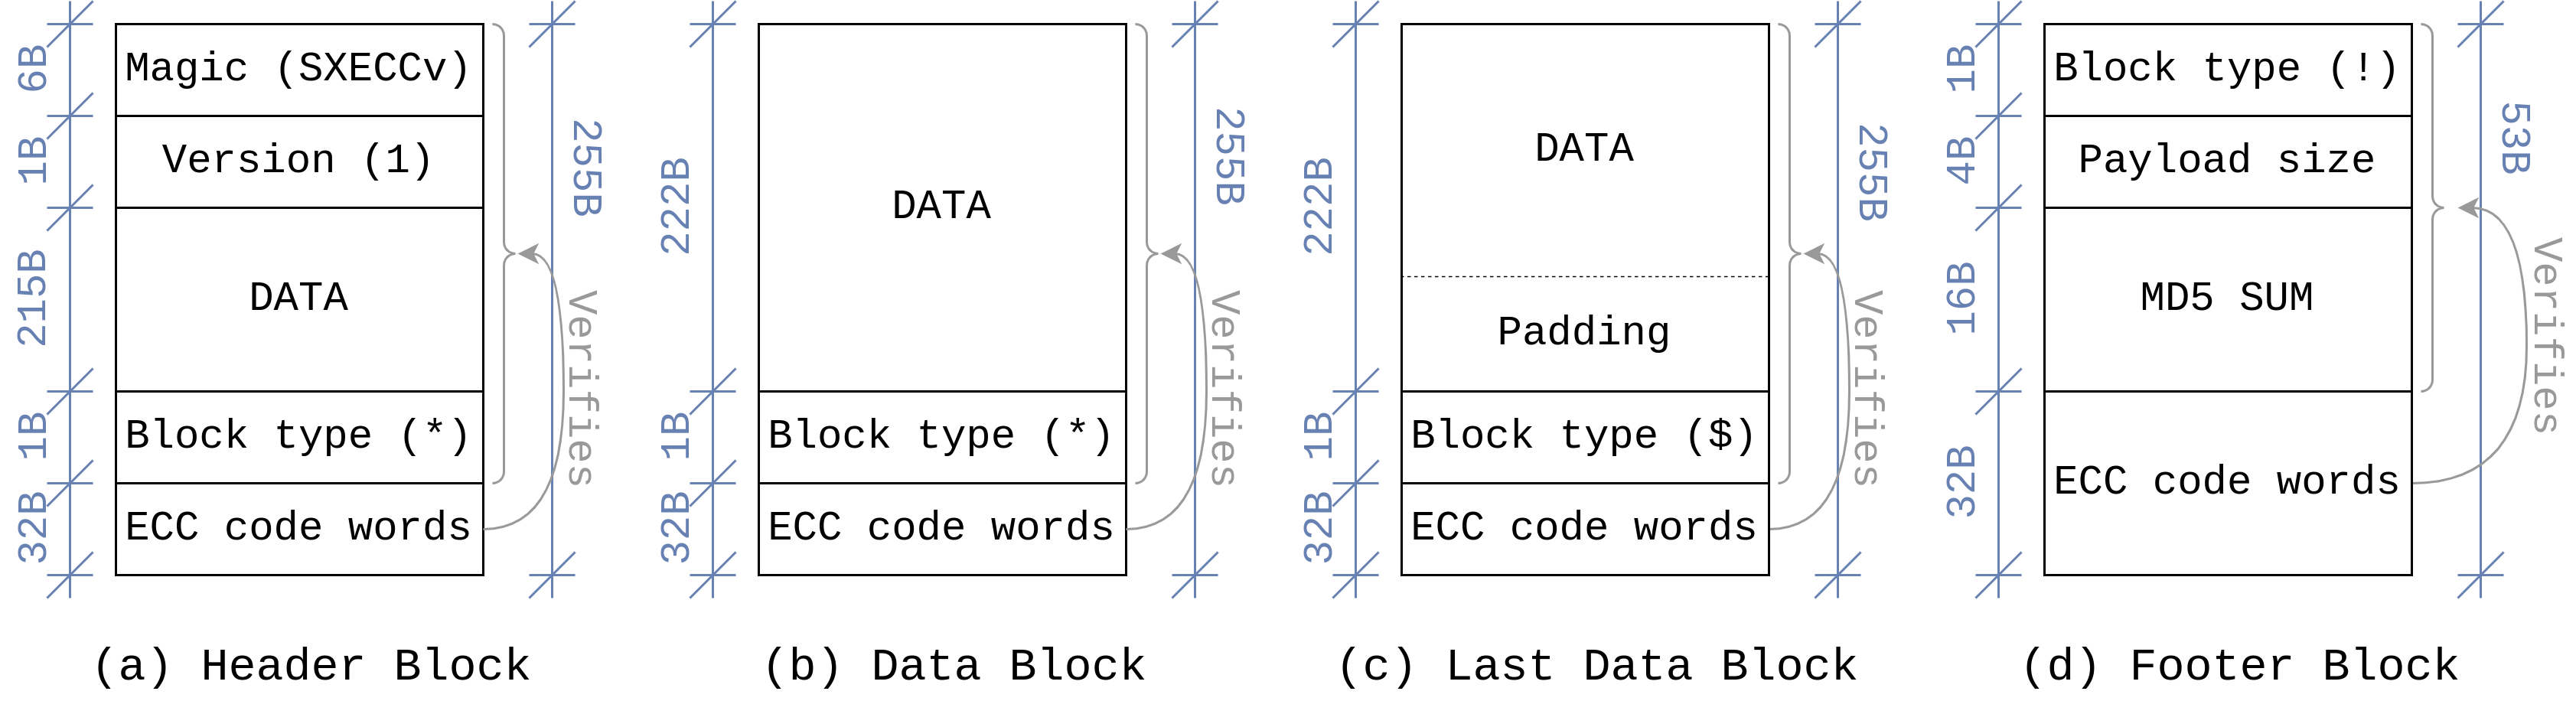
The content of ECC-protected files is organized into blocks of different types, the above figure shows how each block is structured.
The file starts with a header block (a), which contains the magic number and the version of the protocol, along with some data and the corresponding control codes.
Then, there can be zero or more data blocks (b) containing just data and control codes.
A last data block (c), which is recognized by its block type field ($, instead of *), marks the end of the payload, some padding is added here if needed.
Finally, the footer block (d) contains the size of the payload (needed to know the number of padding bytes), an MD5 checksum of the whole payload and, of course, ECC code words for the footer block itself.
sxverity
sxverity is a custom wrapper for the device-mapper-verity (dm-verity) kernel feature, which provides transparent integrity checking of block devices.
The source code of the tool is not publicly available, thus we had to reverse the compiled binary to understand the internals.
This provides both data integrity and authenticity thanks to a signature check that verifies the whole content of the device.
sxverity internally uses the dm-verity kernel feature, by directly interacting with it through the /dev/mapper/control device.
SpaceX only tackled the verification of the root hash, everything underneath, which is handled by the kernel, has not been reimplemented, a nice explanation of how this works can be found here.
As we have seen in previous sections, sxverity is used to verify some of the partitions that reside in the persistent memory, this is to prevent persistent exploits.
But as we'll see in the next sections, it is also used to verify software updates for the dish. Thus, it is a critical component for the overall security of the device.
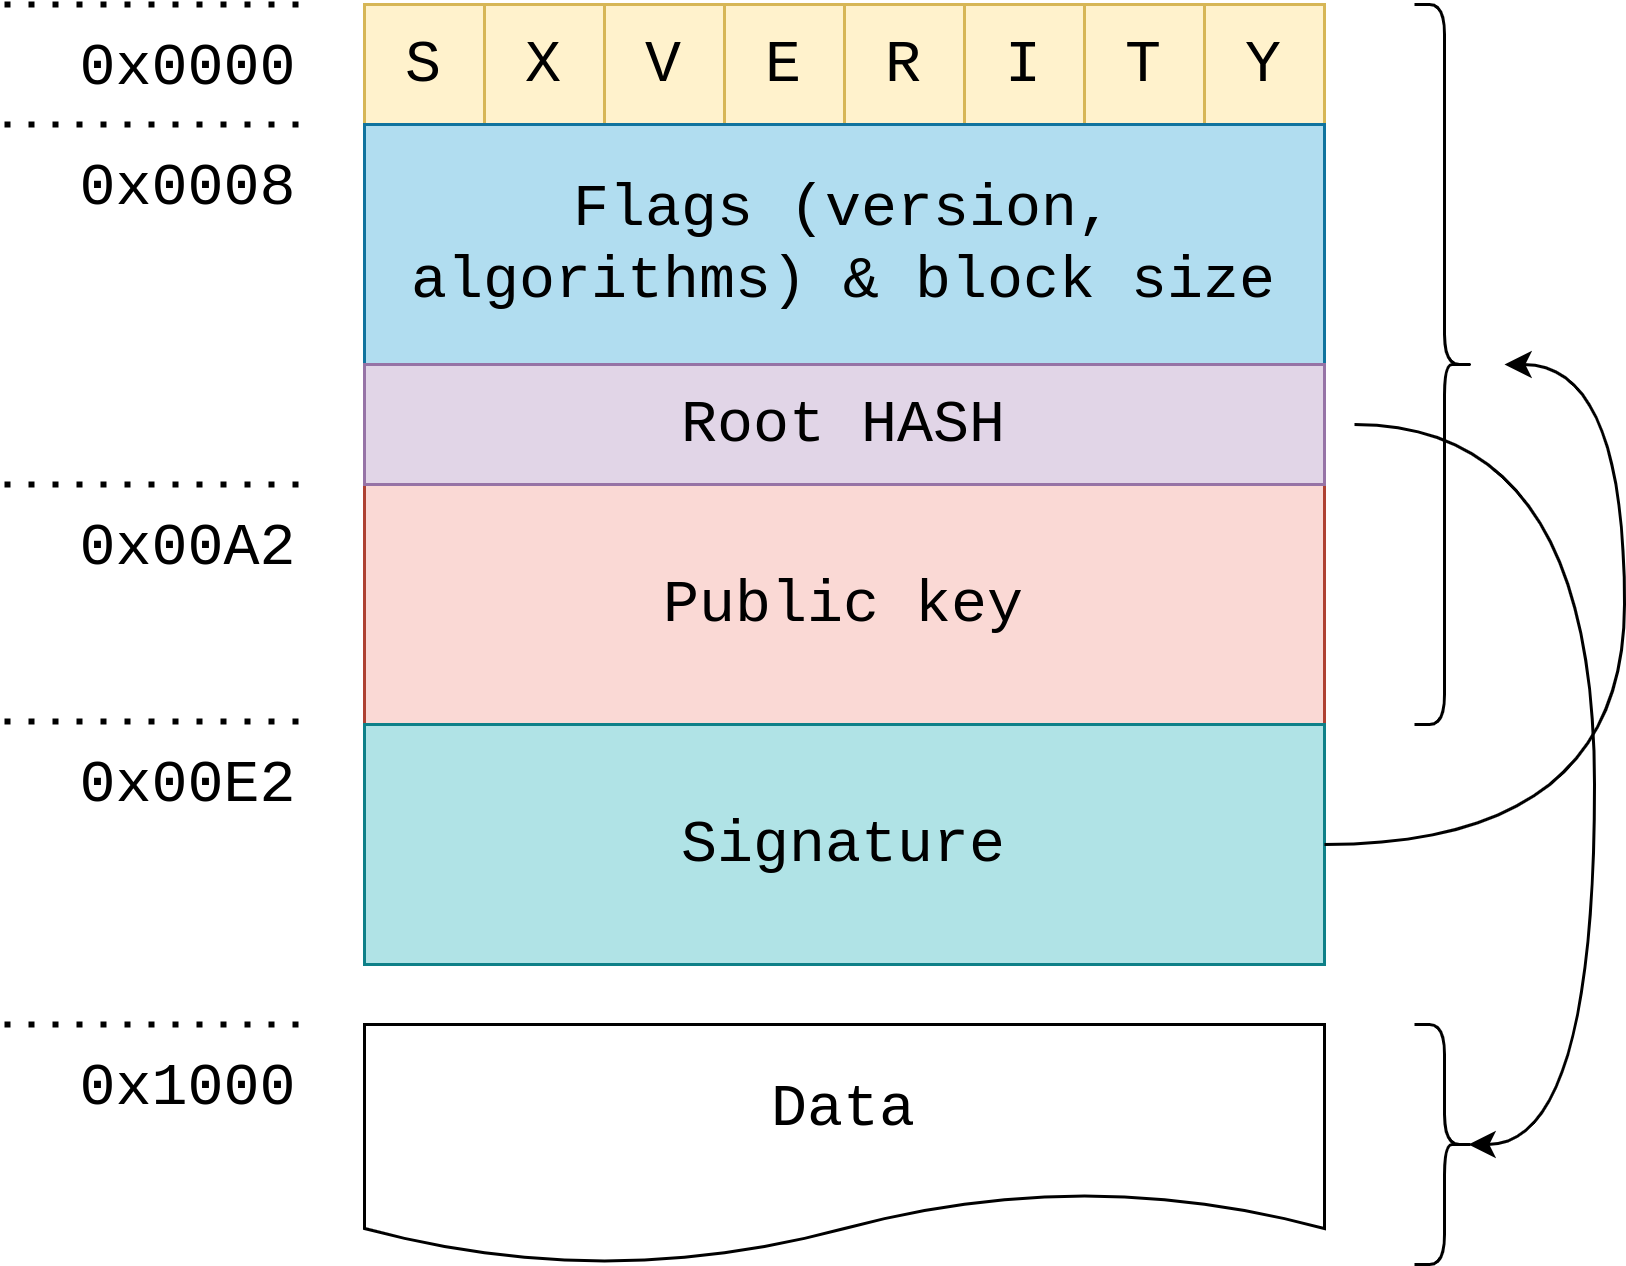
In the picture above you can see the structure of a sxverity image.
It is composed of a header, that is repeated 4 times, possibly signed with different public keys, which contains:
- The magic bytes
"sxverity". - The version and some flags indicating which algorithms have been used for signing and hashing.
- The root hash, which indirectly covers the whole payload (through the hash tree).
- The public key that has been used to sign the image.
- The signature of all the fields above, using an elliptic curve (ED25519).
The parsing and verification procedure performed by this process will be described in the Fuzzing section.
Runtime overview
In this section, we will discuss what happens after the bootloader chain, starting from the Linux's init script to the processes that handle the runtime of the User Terminal.
The init script is the first process started by the kernel and usually has a process identifier (PID) equal to 1.
Its main task is to start all the other runtime processes needed for the system to be useful, and remains running until the system is shut down. It will be the "oldest" ancestor of any other process and it is also used by the user to start, stop and configure daemons once the system is up and running.
The most common init script you can find in an end-user Linux distribution is systemd, which is a collection of tools to manage the whole runtime of the system (e.g. systemctl), among which there is also the init script.
SpaceX's people like to implement their own software, so they implemented their own init script, which can be found in the ramdisk, at /usr/sbin/sxruntime_start. This uses a custom formatted configuration file that contains the instructions of which processes to start, how to start them and in which order.
#######################################
# user terminal frontend
#
# Wait until dish config partition is set up before launching.
#######################################
proc            user_terminal_frontend
apparmor        user_terminal_frontend
start_if        $(cat /proc/device-tree/model) != 'spacex_satellite_starlink_transceiver'
startup_flags   wait_on_barrier
user            sx_packet
custom_param    --log_wrapped
The snippet above shows how a process called user_terminal_frontend is started:
- It is started only if the condition
$(cat /proc/device-tree/model) != 'spacex_satellite_starlink_transceiver'is satisfied. - It is started after the last process marked with the
barrierflag has exited. - It is executed as the Linux user
sx_packet. - The command line parameter
--log_wrappedis passed to it.
The two configuration files that are parsed by the init script can be found at /etc/runtime_init (ramdisk) and /sx/local/runtime/dat/common/runtime (runtime image).
The first one handles system-level services and configurations, such as mounting partitions (e.g. the runtime), and setting up the network, the console and the logger service.
The second one, instead, handles more high-level processes and configurations, such as starting all the processes contained in the runtime image and initializing encrypted devices.
Additionally, the init script also assigns priorities and specific CPU cores to those processes, by following some rules listed in another configuration file, that can be found at /sx/local/runtime/dat/common/runtime_priorities.
File system & mount points
First of all, the root filesystem is copied in RAM by the last bootloader (U-Boot, BL33), and is mounted at /.
Partitions of the eMMC can be accessed by the system through the files /dev/blk/mmcblk0pN where mmcblk0 is the name of the eMMC and N is the partition index, starting from 1.
For convenience, a script will then create some symbolic links to these partitions to use a more explicit name, as shown below.
# [...]
ln -s /dev/mmcblk0p1 /dev/blk/bootfip0
ln -s /dev/mmcblk0p2 /dev/blk/bootfip1
ln -s /dev/mmcblk0p3 /dev/blk/bootfip2
ln -s /dev/mmcblk0p4 /dev/blk/bootfip3
# [...]
Since almost every partition is duplicated, another script will then create additional links in the folders /dev/blk/current and /dev/blk/other, the first one containing the partitions that are currently being used by the system and second one containing the other ones, that will be used in case of a software update.
The system knows which partitions have been used for the current boot by looking in /proc/device-tree/chosen/linux_boot_slot which is populated by the bootloader.
Then, the runtime partition is unpacked using sxverity and the content is extracted to /sx/local/runtime.
This partition contains two folders:
bincontains binaries and executable scripts.datcontains a lot of additional data like AppArmor rules, hardware-specific configurations and generic configuration files, such asdat/common/runtimewhich is the (second) configuration file used by the init script.
After these operations, the root filesystem is remounted with the ro (read-only) flag.
Additional partitions are then mounted, such as:
/dev/blk/current/version_infoon/mnt/version_info(throughsxverity)./dev/blk/dish_cfgon/mnt/dish_cfg(throughLUKS)./dev/blk/edron/mnt/edr(throughLUKS).
Daemons
After the elaborate boot procedure and system configuration we finally reach a state in which some processes are running, each one with a unique task, to provide the user with the service the device is built for, i.e. a satellite internet connection. As you may have guessed, many things happen in the background to ensure a stable enough internet connection such as sending and receiving traffic to and from satellites, choosing which satellite to connect to, changing satellite (without disrupting the Internet connection) when the current one moved too far, handling user requests coming from the mobile application, etc. Furthermore, these processes need to communicate continuously with each other to synchronize and cooperate, and with Starlink's cloud services for backend functionalities.
Most of the binaries have been implemented in C++ and some of them are also statically linked. Due to this, it was challenging to reverse-engineer these binaries and due to time constraints, we were unable to fully comprehend all of them. Some work was done to identify statically linked library functions, using the binary diffing technique. It is also probable that these programs were implemented using the State Machine Design Pattern, which makes heavy use of features of Object Oriented Programming such as multiple inheritance, virtual methods and generic types. This made the reverse-engineering process even more difficult due to the complex structures that are produced by the compiler when using these features.
We tried to compare the network stack of the User Terminal with the known ISO-OSI stack, and the following could be a proper mapping:
phyfw(Physical Firmware, perhaps) handles the physical layer of the satellite communication, which includes modulation/demodulation of RF signals.rx_lmacandtx_lmac(rx/tx lower Medium Access Control, perhaps) fall in the data link layer, and handle the physical access to the medium, separately for receiving and transmitting.umac(upper Medium Access Control, perhaps), could represent the network layer. It handles the access to the medium, at a higher level, and coordinates between the transmission and reception of frames. It may also be in charge of choosing which satellite to connect to.connection_managercould represent the transport layer and, if it's the case, it handles stateful connections between the dish and satellites, in which the traffic will be exchanged.ut_packet_pipelineis probably used to create an encrypted tunnel in which user traffic will be exchanged using the secure element on the dish for handshakes. This could be associated with the known protocols such as TLS, DTLS, IPsec or, again, a custom one.
Other than these network-related processes there also are some processes that handle system telemetry, software updates, system health status and outage detection/reporting and finally a "control" process that acts as an orchestrator for all the other processes.
On the other hand, one of the binaries, namely user_terminal_frontend, is implemented in Go, an open-source (compiled) programming language from Google.
Go binaries are statically linked and they include the go runtime, so they are pretty big, but luckily they also include symbols that are used by the runtime for comprehensive runtime error reporting, which includes function names, source code line numbers and data structures.
All this precious information can be recovered using a plugin for Ghidra called GolangAnalyzer which was quite effective.
The extension also recovers complex data types and creates the corresponding C-like structures in Ghidra, which is extremely useful when working with an OOP language.
Additional manual analysis is needed because of the custom calling convention used by Go, but after this, the resulting disassembled C code is easily readable.
Our primary focus was on the runtime's higher-level components, which include this process.
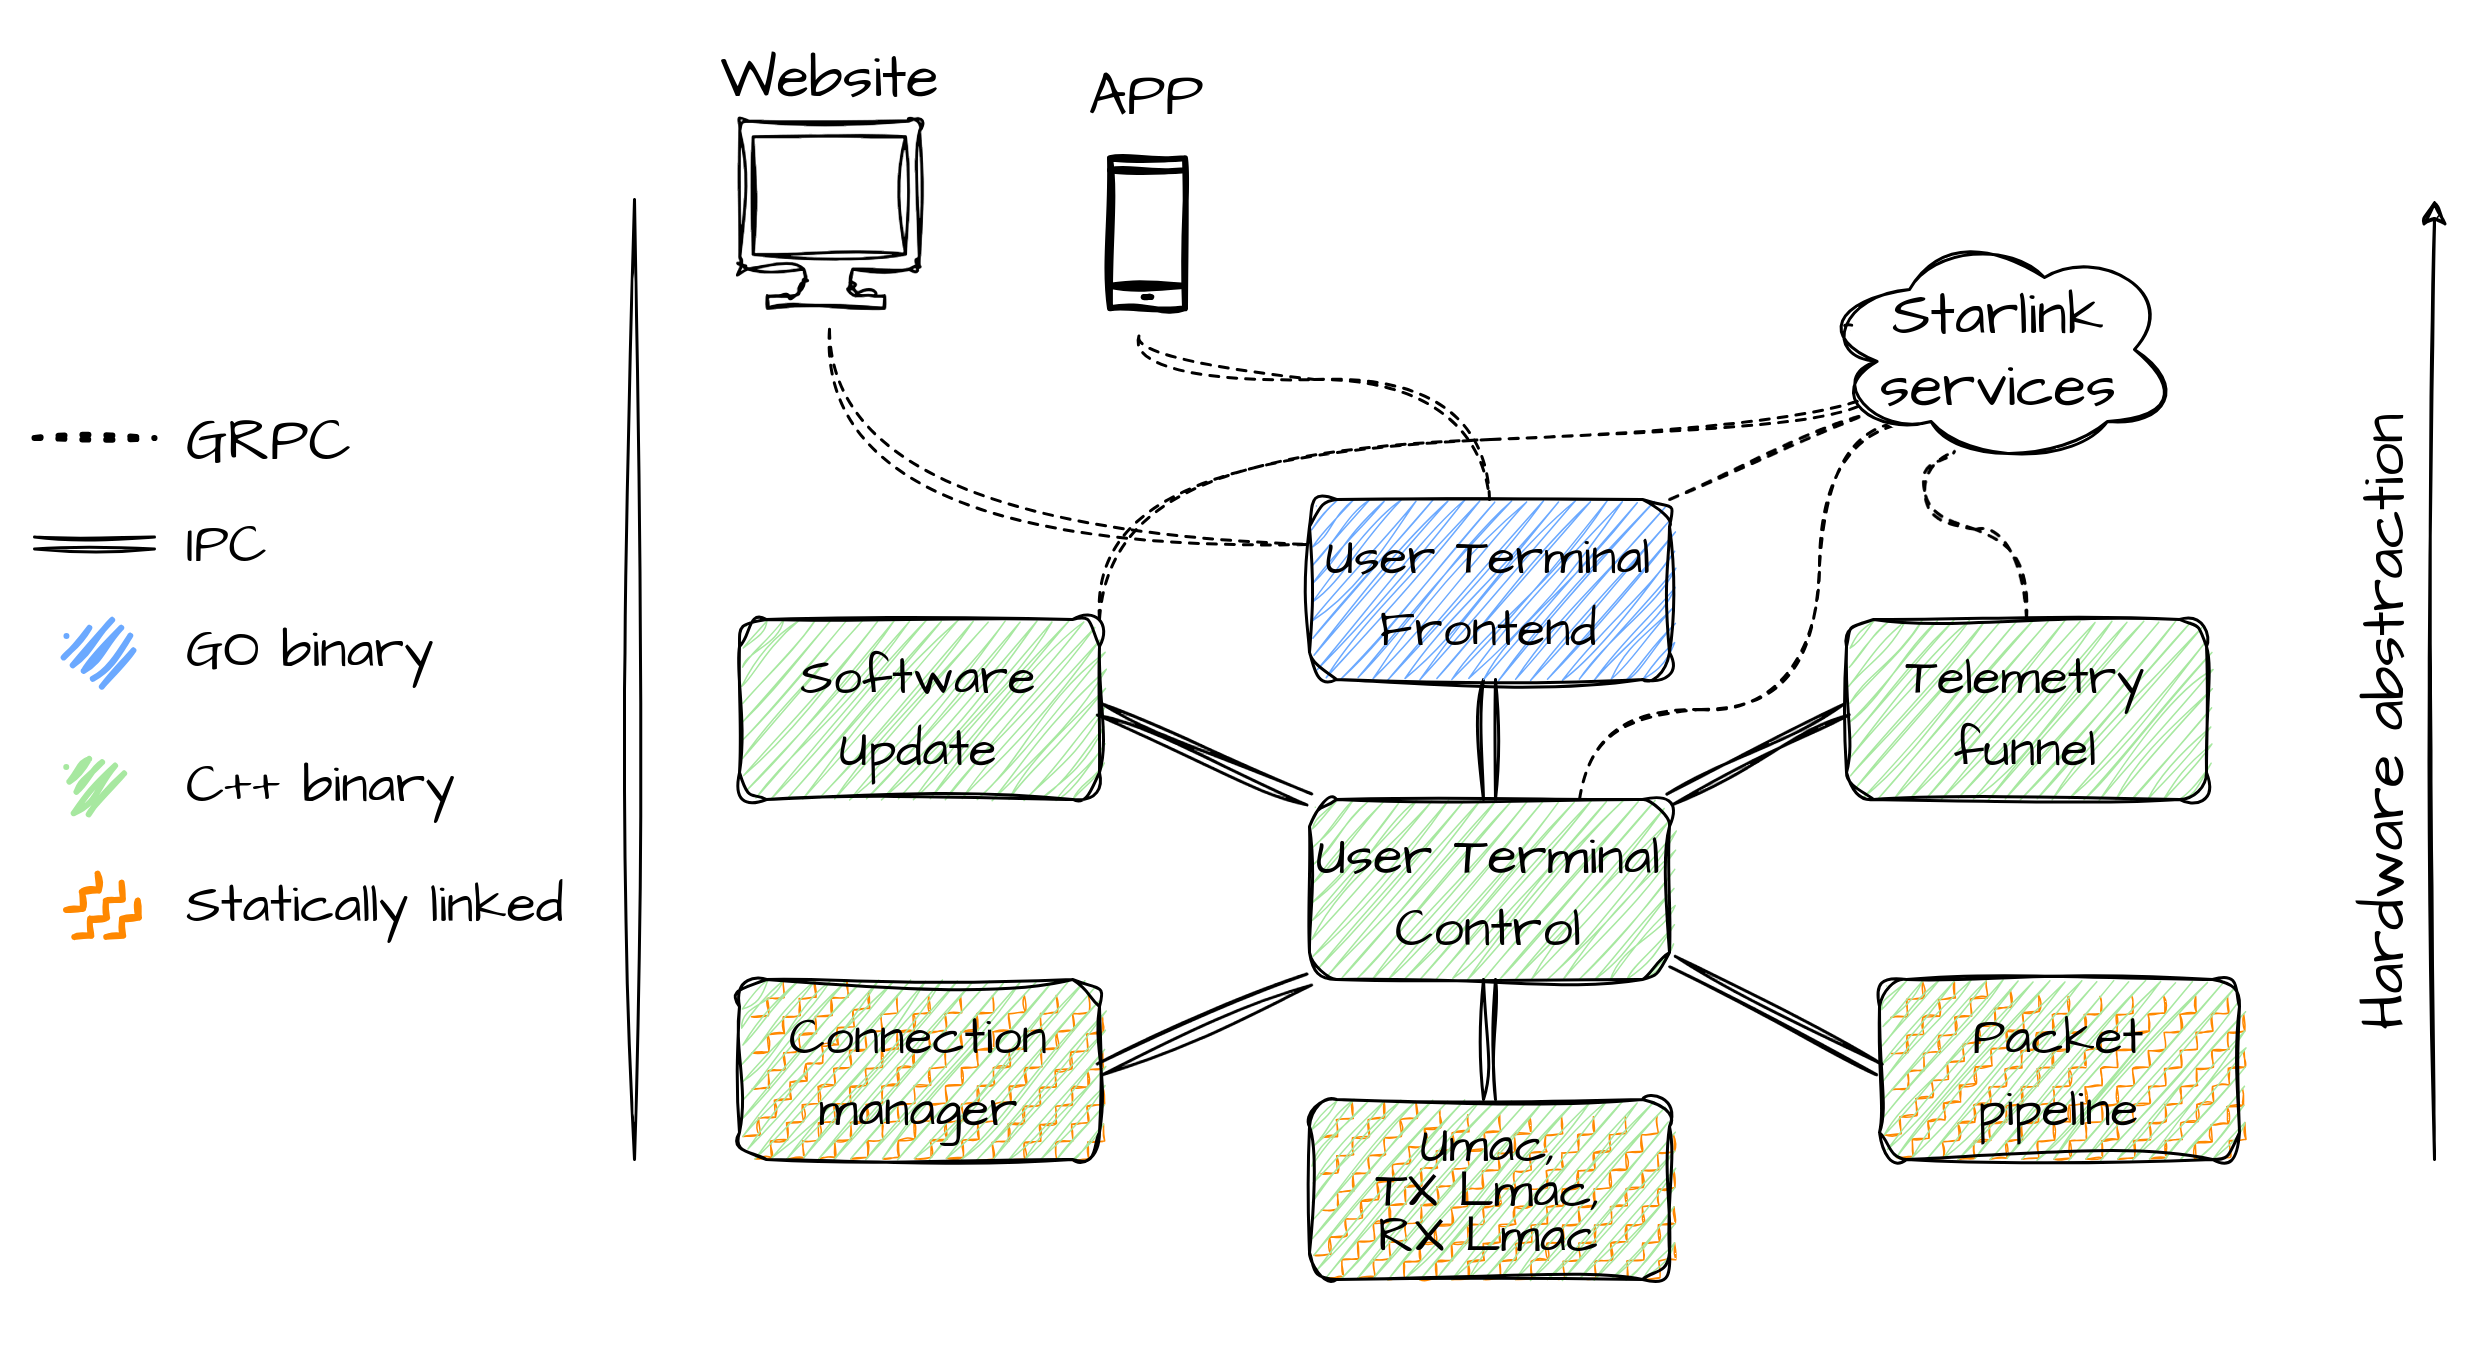
To summarize this section, in the picture above you can see a sketch of the architecture of the runtime (not complete), in which you can see that processes at the bottom, "closer" to the hardware, are statically linked, probably for performance reasons, and communicate only with the control process, while the other ones also communicate with Starlink's cloud services, through gRPC. In section Communications, we will tackle all the communications shown by this picture in more detail. And finally, there is the go binary (which is technically statically linked as well, but just because of the language constraint), which communicates with frontend applications used by the user.
Runtime emulation
Due to the negative results of our Fault injection attack, we didn't have access to a live device on which to check our findings or perform some dynamic analysis. Thus, we tried to set up an emulated environment, as similar as possible to the real device, that would be capable of executing runtime binaries. We are emulating the entire system (full-system emulation), starting from the kernel, using QEMU as an emulator engine. In the following paragraphs we describe every challenge we had to deal with, including the ones we couldn't solve, while setting up the environment and the final result.
The first choice to be made is which hardware we want QEMU to emulate.
When you want to emulate an IoT device using QEMU you usually look for the hardware implementation of the particular device for QEMU, which is usually available for common, off-the-shelf devices such as Arduino, Raspberry Pi, and less-known boards as well.
The hardware implementation of our device was, of course, not available, so we used the (aarch64) virt machine, which is the most generic one.
The proper way to emulate the whole device would have been to construct this machine specification for QEMU, as well as implement emulators for every piece of hardware that is present on the board.
The problem is that most of the peripherals present on the device are not open hardware, and even if they were, implementing all of them in QEMU would have been a lot of work.
Instead, using the virt machine and tweaking the Device Tree is much easier, at the cost of not having most of the hardware peripherals and thus some limitations.
Another problem was the choice of the kernel to run in QEMU.
We tried with the original one, extracted from the FIT of the firmware, but that didn't work in the emulated environment. So we decided to compile one ourselves.
Unfortunately, the open-source version of Linux published by SpaceX is 5.10.90, while the one found on the dish was 5.15.55, so we used the mainstream Linux kernel.
A lot of tweaks in the compile-time configuration had to be made for it to boot, some of them required by QEMU and some of them required by Starlink's software.
It is possible to extract this configuration from a compiled Kernel image, using the script extract-ikconfig from the Linux kernel repository, which was used to find differences between the default one and the one configured by SpaceX.
The device tree not only contains information about hardware peripherals but also data that is used by the runtime, such as public keys used by sxverity.
Additionally, the U-Boot bootloader also populates the FDT before booting the Linux kernel, by adding, for example, which set of partitions have been used in the current boot, the name of the main network interface and more.
All this information is of course not included in the FDT set by QEMU for the virt machine, thus we extracted this FDT, using the dumpdtb flag, and added the missing information, as shown below, which can then be recompiled using the Device Tree compiler (dtc) and given to QEMU using the -dtb flag.
# ...
model = "spacex_satellite_user_terminal";
compatible = "st,gllcff";

chosen {
    linux_boot_slot = "0";
    ethprime = "eth_user";
    board_revision = "rev2_proto3";
    bootfip_slot = <0x00>;
    boot_slot = <0x0006>;
    boot_count = <0x0010>;
    # ...
};

security {
    dm-verity-pubkey = <REDACTED>;
    # ...
};
# ...
As the root filesystem, we used the one we extracted from the dish, with some modifications.
- Since we want to have access to the emulated dish, it must think it is a development version so that password access is enabled, thus we patched the
is_production_hardwarescript. This could have been done in multiple ways, such as directly editing the/etc/shadowfile, or adding our public key to the SSH'sauthorized_usersfiles, but what we did is more effective because emulating development hardware will also enable other debugging features. - We also included the extracted runtime where it would have been mounted and removed the integrity verification and mounting step from the
/etc/runtime_initfile to be able to also tamper with the contents of that partition. - In the
/etc/runtime_initfile we also added some custom steps, for example, one that sets up our emulated network, and one that mounts read-write partitions as emulated volumes.
Additional patches will be needed for other programs to start in the emulated environment.
We have also included some additional software that will be used for testing purposes such as gdbserver. But for these programs to be able to run, we either had to cross-compile them using the same build toolchain, or cross-compile them statically.
Even though both the root filesystem and the runtime are already placed in memory when the Linux kernel boots, a lot of processes directly access some partitions of the eMMC.
So we've also instructed QEMU to create a raw virtual block device, containing the original image dumped from the physical board.
However, since it is not seen by the kernel as an eMMC chip, the assigned name is different from the one assigned by the physical device.
Because of this, we had to change every reference to mmcblk0 to vda, which is the name assigned by the kernel in the emulator.
Fortunately, as we saw in the previous section, the device only uses the name of the device in a script that creates some symbolic links to every partition, so we just had to patch that script and the command line argument for the kernel.
Partitions that are mounted with write permission, are instead mapped to a folder on the host so that it is possible to inspect their content afterward.
As for the network, it is not necessary to replicate the exact network configuration of the dish (as it is not very clear to us), we just need to have the right interface names and internet access. This was done by using a tap interface, bridged to the host which acts as a NAT gateway, as shown in the following scripts.
Host:
#!/bin/bash

ifconfig $1 0.0.0.0 promisc up
brctl addbr virbr0
brctl addif virbr0 $1

ip link set dev virbr0 up
ip link set dev $1 up

ip addr add 192.168.100.2/24 dev virbr0
echo 1 > /proc/sys/net/ipv4/ip_forward
iptables -t nat -A POSTROUTING -o wlp0s20f3 -j MASQUERADE
Guest:
#!/bin/sh

ip link set dev eth0 name eth_user
ip link set dev eth_user up
ip addr add 192.168.100.1/24 dev eth_user

route add -net 0.0.0.0 netmask 0.0.0.0 gw 192.168.100.2 dev eth_user
Emulation Results
As explained in previous sections, most of the hardware is not present in the emulated environment, so every component that tries to use it will fail.
Lower-level processes, such as phyfw and [rx/tx]_lmac, whose main task is to interact with Starlink's hardware won't work in this environment.
But also other binaries require some hardware to be present, the most common one is the secure element, which is used in most of the cryptographic exchanges.
So for those binaries to work we patched every instruction that would make the program crash, but if the hardware is required for substantial parts of the process, this solution is pointless.
In the end, we managed to emulate, among the main processes discussed in the Daemons subsection, only user_terminal_frontend, starlink_software_update, umac and the ones related to telemetry, along with smaller processes.
Further work on this topic could incrementally add support for some peripherals of the board, hence being able to emulate more and more processes.
Here you can see the console output of the final phase of the boot process in the emulated environment.
# [...]
# kernel messages and (a lot of) errors from applications
# trying to access missing hardware peripherals
# [...]

setup_console: Development login enabled: yes

SpaceX User Terminal.
user1 login: root
Password:

                                                                *
                                                 +
                                       +    +
                                +     +
                           +      +
+ + + + +              +     +
  +        +       +     +
     +       + +      +
        +   +      +
          +      + +
      +      +        +
   +       +    +        +
 +       +         +        +
+ + + + +             + + + + +


The Flight Software does not log to the console. If you wish to view
the output of the binaries, you can use:

tail -f /var/log/messages

Or view the viceroy telemetry stream.

[root@user1 ~]#
All the scripts and files presented above are available here, but we won't publish the whole UT's firmware, so you'll still have to extract it yourself to run the emulator.
Communications
In IoT devices, communication with other devices is often a crucial function, if not the main one. This is also the case for our device, which is basically an internet gateway and, as you can imagine, in this case, communication between the device and the satellites is the main function of the User Terminal. We briefly analyzed the physical layer of this communication, but we didn't focus on it. On a higher layer, the communication with satellites is split into two "planes":
- The Data Plane, which contains user traffic to and from the Internet.
- The Control Plane, which contains every other kind of traffic, such as control messages between the antenna and the satellite (e.g. Connection handshake).
But these are not the only communications happening in the device, in the following sections we will also see how the device interacts with user front-end applications and also how the different components inside the device communicate with each other.
Front-end applications
The communication with front-end applications is handled by the process user_terminal_frontend, which we were able to both run in the emulated environment and reverse-engineer, thanks to the language it has been implemented in (Go).
From the front-end applications, the user can see some statistics of the device and can change some high-level settings such as Wi-Fi credentials, reboot or stow the dish, etc.
These interactions use gRPC (Google's Remote Procedure Calls), which in turn uses protobuf underneath.
Protobuf definitions can be gathered either by extracting them from the binary (using pbtk) or by asking the reflection server of the process itself (using grpcurl, for example).
Some tools have been implemented as alternative front-end applications that use this protocol.
The aforementioned applications, implemented in Python, use the gRPC APIs exposed by the frontend binary, providing the user with an alternative user interface to inspect the statistics of the dish.
The authors of these applications probably gathered the protocol definitions from the mobile application or by using the reflection server.
In the following code snippet, you can see the (partial) definition of the Request message, which contains a few ids and one specific request, among the ones listed.
Every inner request has its definition, with the parameters the server needs to process the request, and a corresponding response that will hold the result.
message Request {
    uint64 id = 1;
    uint64 epoch_id = 14;
    string target_id = 13;

    oneof request {
        GetNextIdRequest get_next_id = 1006;
        AuthenticateRequest authenticate = 1005;
        EnableDebugTelemRequest enable_debug_telem = 1034;
        FactoryResetRequest factory_reset = 1011;
        GetDeviceInfoRequest get_device_info = 1008;
        GetHistoryRequest get_history = 1007;
        GetLogRequest get_log = 1012;
        GetNetworkInterfacesRequest get_network_interfaces = 1015;
        GetPingRequest get_ping = 1009;
        PingHostRequest ping_host = 1016;
        GetStatusRequest get_status = 1004;
        RebootRequest reboot = 1001;
        SetSkuRequest set_sku = 1013;
        SetTrustedKeysRequest set_trusted_keys = 1010;
        SpeedTestRequest speed_test = 1003;
        SoftwareUpdateRequest software_update = 1033;
        DishStowRequest dish_stow = 2002;
        StartDishSelfTestRequest start_dish_self_test = 2012;
        DishGetContextRequest dish_get_context = 2003;
        DishGetObstructionMapRequest dish_get_obstruction_map = 2008;
        DishSetEmcRequest dish_set_emc = 2007;
        DishGetEmcRequest dish_get_emc = 2009;
        DishSetConfigRequest dish_set_config = 2010;
        DishGetConfigRequest dish_get_config = 2011;
        // [...]
    }
}
There are two ways to communicate with this gRPC, either by using an insecure channel or by using a secure channel, which involves TLS and mutual authentication using certificates stored in the secure element. The mobile application and the web interface both use the insecure channel, so the encrypted one must be used by something else.
Among the requests that can be made to the server, many of them are meant for front-end applications, a few examples are:
FactoryResetRequest, which requests a factory reset of the dish.GetDeviceInfoRequest, which returns some information about the device.GetStatusRequest, which requests the status of the dish.RebootRequest, which asks the dish to reboot.
But some requests do not look like they are used by those applications, such as:
SetTrustedKeysRequest, which supposedly sets the provided public keys for future use by the process or by the SSH agent.
message SetTrustedKeysRequest {
    repeated PublicKey keys = 1;
}
GetHeapDumpRequest, which supposedly returns a dump of the Heap section of the process.SoftwareUpdateRequest, which supposedly initiates a software update with the provided update bundle.
Unfortunately, most of these requests are not implemented in the binary we were analyzing (e.g. SetTrustedKeysRequest, GetHeapDumpRequest), and some of them require authentication (e.g. DishGetContextRequest, DishGetEmcRequest) both on the transport layer (secure gRPC channel) and application layer (by using the AuthenticateRequest).
We are not entirely sure who is supposed to use these requests and why most of them are not implemented in the binary, they could be used by another Stalink product such as the Wi-Fi router, or by Starlink support in the case of a partially bricked device, for remote assistance.
The most interesting request that is both implemented and does not require authentication is the SoftwareUpdateRequest, which will be explained better in Section Fuzzing.
Further work on this topic would be to analyze further every request handler for bugs or, better to fuzz them since there exist effective mutators for the protobuf protocol, such as libprotobuf-mutator.
Inter-Process Communication
Every process running in the runtime continuously shares information with other processes, to collaborate and share statistics.
As you can see from the figure showing the runtime architecture, every process only communicates with the User Terminal Control, which acts as an orchestrator for the whole runtime.
The protocol they are using is designed by SpaceX and it's called Slate Sharing.
It uses UDP for transport, and every process starts listening on a different port, on the loopback interface and will receive messages from the control process on that port.
On the other hand, the control process starts listening on multiple ports, one for every process that needs to communicate with it, so that the communication is bidirectional and without conflicts between processes.
Port numbers are configured through a configuration file that can be found at /sx/local/runtime/common/service_directory, in the following snippet, you can see a part of it, which lists the port numbers for communications between software update and control, and between frontend and control.
################################################################################
# Software update
software_update_to_control                localhost   27012       udp_proto
control_to_software_update                localhost   27013       udp_proto

################################################################################
# Frontend
control_to_frontend                       localhost   6500        udp_proto
frontend_to_control                       localhost   6501        udp_proto
Every couple of processes exchange different kinds of data, and messages do not contain any information about the content nor the structure of the data they transport, unlike other protocols such as JSON or XML. Thus, to understand the content of messages we had to reverse engineer one of the binaries that makes use of the protocol, and in our case, the best choice was once again the user terminal frontend, which is the one implemented in Go.
Data is exchanged in binary form, by sending raw packed (no padding) C structures, in big-endian. Every message contains a header, holding some information about the message, and a body, containing the actual data to be shared. In the following snippet, you can see the data structure representing the message header, from the GolangAnalyzer Ghidra plugin. With the same technique, we also extracted the structure of the body of messages between the frontend process and control.
**************************************************************
* Name: sx_slate.SlateHeader                                 *
* Struct:                                                    *
*   +   0x0    0x4 uint BwpType                              *
*   +   0x4    0x4 uint Crc                                  *
*   +   0x8    0x8 longlong Seq                              *
*   +  0x10    0x4 uint Frame                                *
**************************************************************
The header contains:
BwpType, which is a fixed value, acts as a "magic number" for the protocol (00 00 01 20).Crc, whose name suggests it is a Cyclic Redundancy Check, so a sort of error-detecting code for the message body, but by reverse engineering and sniffing messages, this field seems to be fixed as well, but it is different for every couple of messages.Seq, which is a sequence number that is incremented every message, but the protocol does not include any acknowledgment mechanisms to resend lost messages.Frame, which is used in case of fragmentation, i.e. when the message is bigger than the MTU (Maximum Transmission Unit), which is usually set to 1500 bytes. In this case, the body of the message is split into multiple frames, each one having an identical header, apart from theFramefield, which is incremented each frame, starting from 0.
The body of the message is encoded in the same way, as an example, in the following snippet, you can see part of the structure of messages sent by the frontend process to control.
**************************************************************
* Name: slate.FrontendToControl                              *
* Struct:                                                    *
*   +   0x0    0x1 bool AppReboot                            *
*   +   0x1    0x1 bool TiltToStowed                         *
*   +   0x4    0x4 uint StartDishCableTestRequests           *
*   +   0x8    0x1 bool IfLoopbackTest                       *
*   +  0x10    0x8 longlong Now                              *
*   +  0x18    0x8 longlong StarlinkWifiLastConnected        *
[...]
Thanks to this information we would already be able to implement a message decoder (which we did), but this would only work for the communication between the frontend process and control. To decode other communications we would need to manually reverse engineer every other binary to find out the structure of messages, perhaps without even finding field names, but as explained in previous sections, it was hard to get useful information from C++ binaries.
Here you can see how we parse the header of Slate messages in Python, using the ctypes package.
class SlateHeader(BigEndianStructure):
    _pack_ = 1
    _fields_ = [
        ('BwpType', c_uint32),
        ('Crc', c_uint32),
        ('Seq', c_longlong),
        ('Frame', c_uint32)
    ]
Then, to understand how the protocol is handled in C++ binaries, we looked for some fields of the structures we knew (the ones of the frontend process) in the control process, which should have them in order to decode those incoming messages.
We couldn't find them in the binary, but we found something way better, in the folder /sx/local/runtime/common there is a set of configuration files, such as frontend_to_control, which contain the structure of every message exchanged by processes.
Here is a snippet containing part of the aforementioned configuration file.
# Slate share message from gRPC frontend process to main control process.
app_reboot                          bool
tilt_to_stowed                      bool
start_dish_cable_test_requests      uint32
if_loopback_test.enabled            bool
now                                 int64
starlink_wifi_last_connected        int64
# [...]
With this, it is much easier to implement a more generic decoder that parses these protocol definitions and decodes messages accordingly. Such a tool has been developed and will be discussed in the next section.
Slate sniffer & injector
Slate messages are sent very fast, thus it is hard to understand what is happening without a proper visualization tool. That is why we've implemented the Slate sniffer, a tool that sniffs UDP packets on the loopback interface and decodes them on the fly, highlighting differences between consecutive messages. In the following figure, you can see the overall architecture of the new tool, which we'll describe in more detail. This tool was implemented for the emulated environment but we designed it keeping in mind that it would need to work also on the real dish. For this reason, most of the work is done in the Sniffer, which is not in the device, and all the communications between the sniffer and the dish happen through SSH.
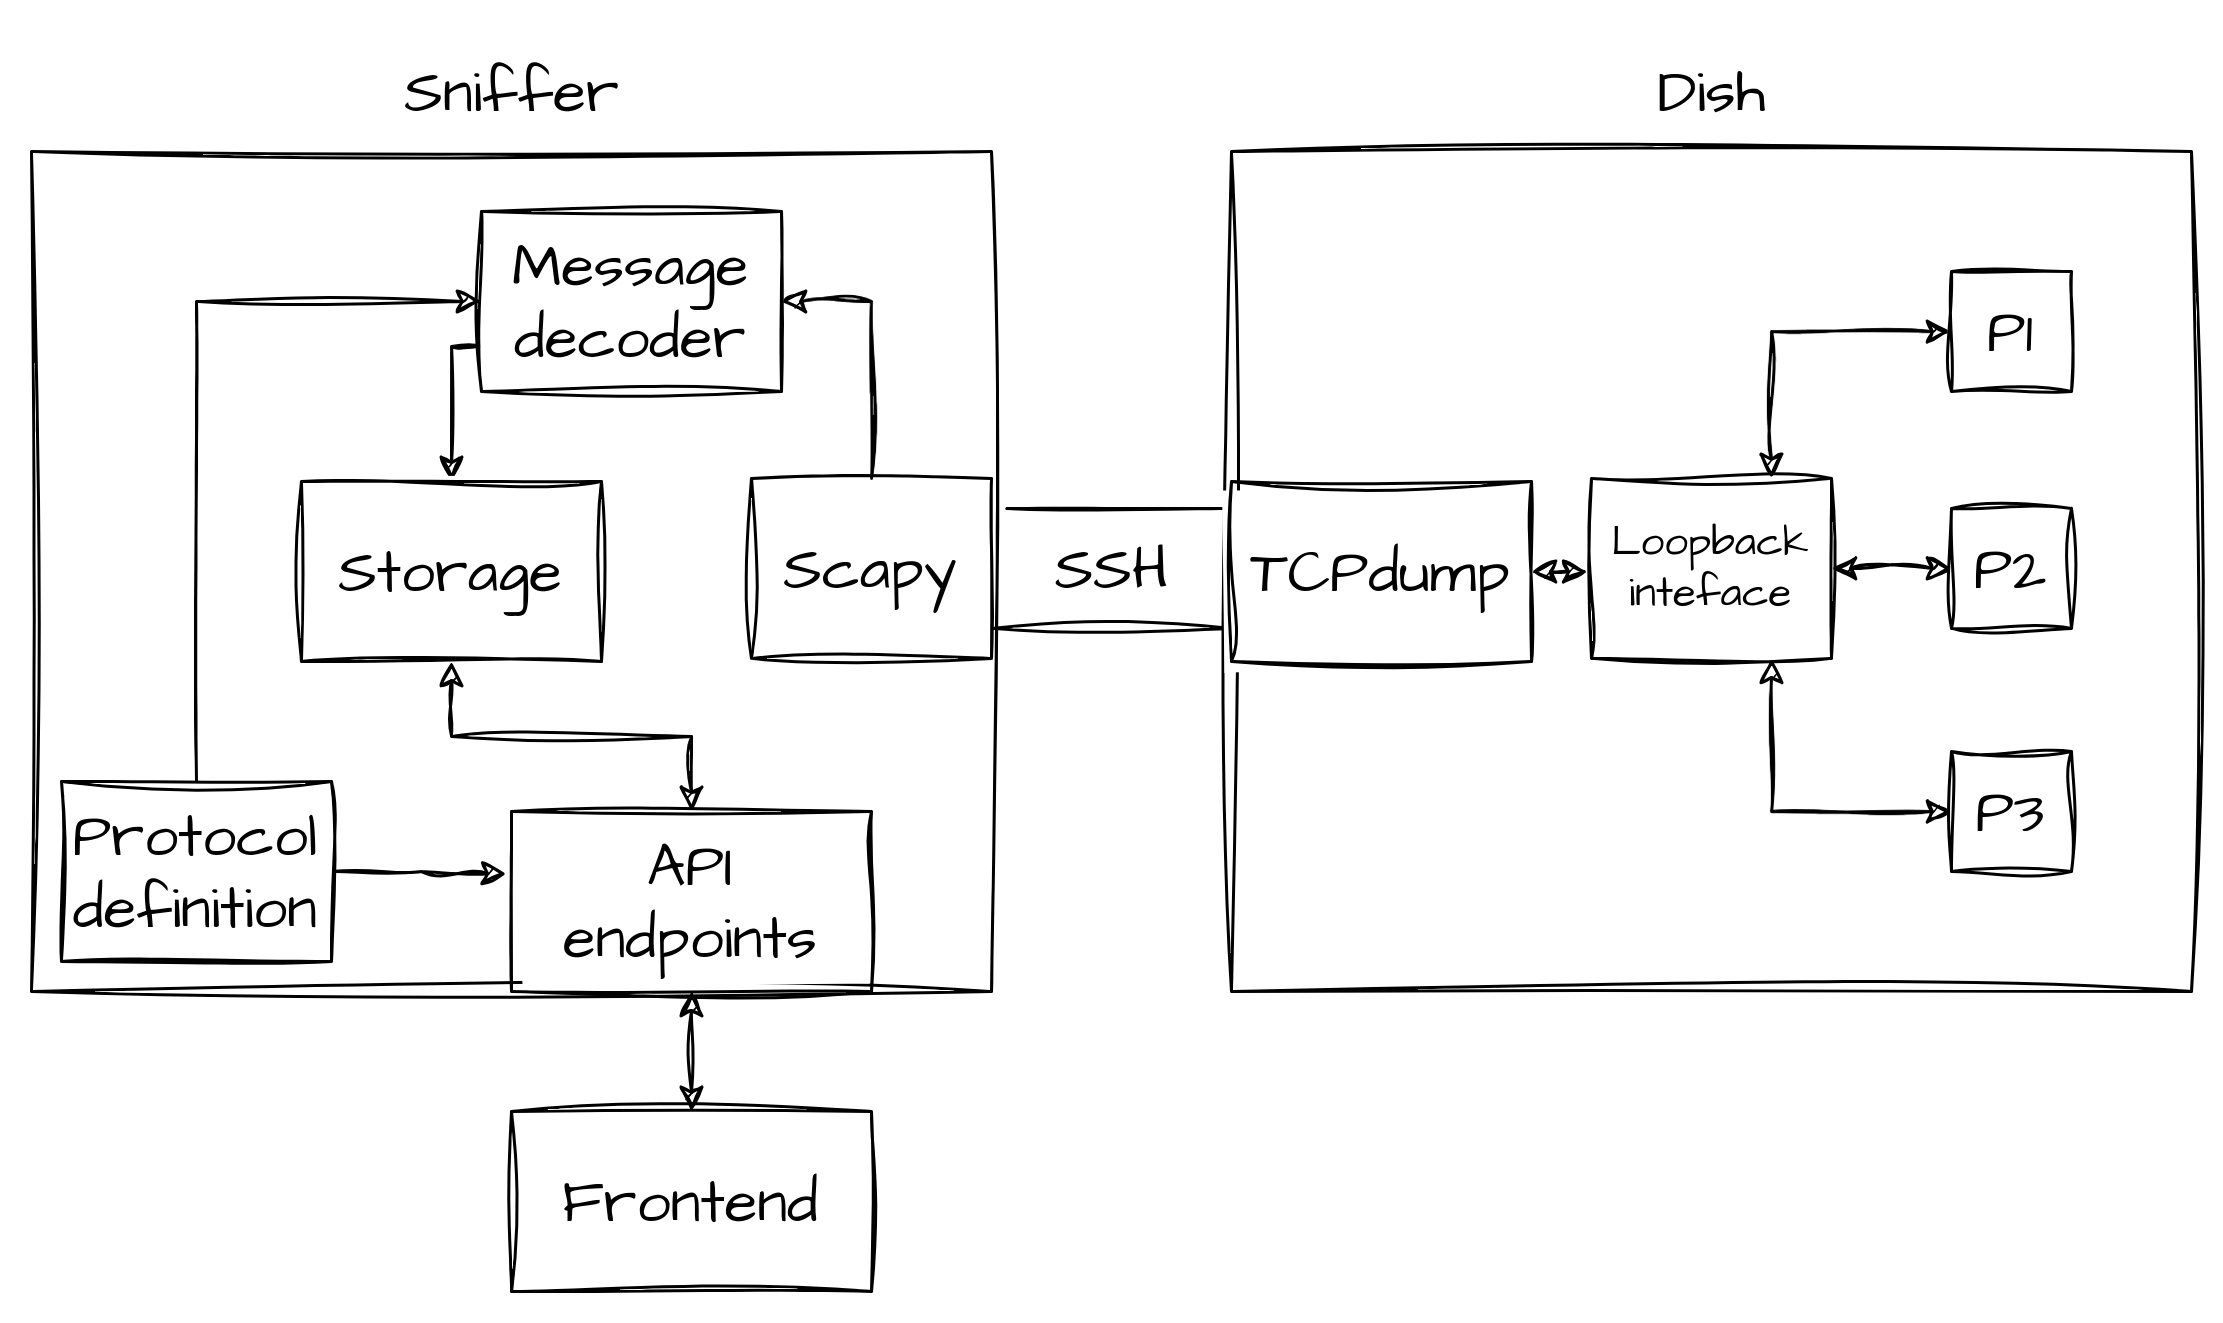
The first component that is used when starting the sniffer, is the protocol definition parser, which will parse configuration files:
service_directoryto know which "services" (i.e. message definitions) are available and on which UDP ports they will communicate.[P1]_to_[P2]for every available couple of processesP1andP2, to know the format of messages that will be exchanged.
This component will create SlateMessageParser objects, that will later be used to decode messages.
The decoding is made using the struct python package.
After this, TCPdump will be launched on the dish, through SSH, and will listen on the loopback interface, only capturing UDP packets that have as the destination port one of the ones found by the parser.
The output of TCPdump is piped to Scapy which will decode the packet, understand which service it comes from, by reading the destination port, and will then extract the UDP payload and pass it to the message decoder.
When a message is parsed correctly, it will be stored in the Storage component, which in this case is a simple in-memory database, only holding recent messages (configurable, based on available memory).
On top of all this, there is a Flask server, exposing some APIs, to know which services are available, to know the schema of a message and, of course, to fetch messages.
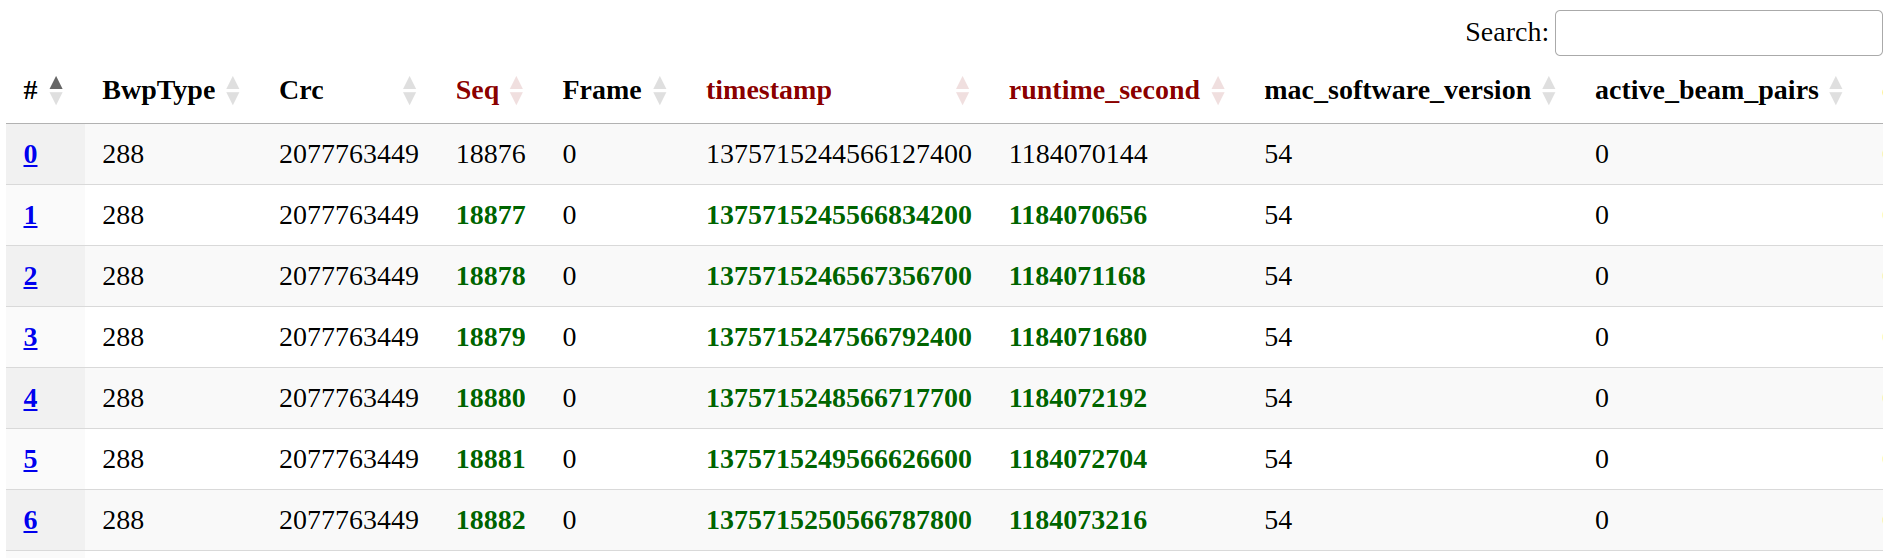
We also implemented a front end, as a simple web interface, which is shown in the following picture.
From the current front end, it is possible to see messages in real-time, spotting differences thanks to the highlighted changes, selecting which fields to show and filtering or ordering them.
The frontend module is easily replaceable thanks to the exposed APIs, thus more complex interfaces can be integrated into the sniffer, to inspect the acquired data in more ways.
After having a way to see messages, we thought it would be interesting to be able to inject custom messages, by editing the ones we are receiving or by creating new ones from scratch.
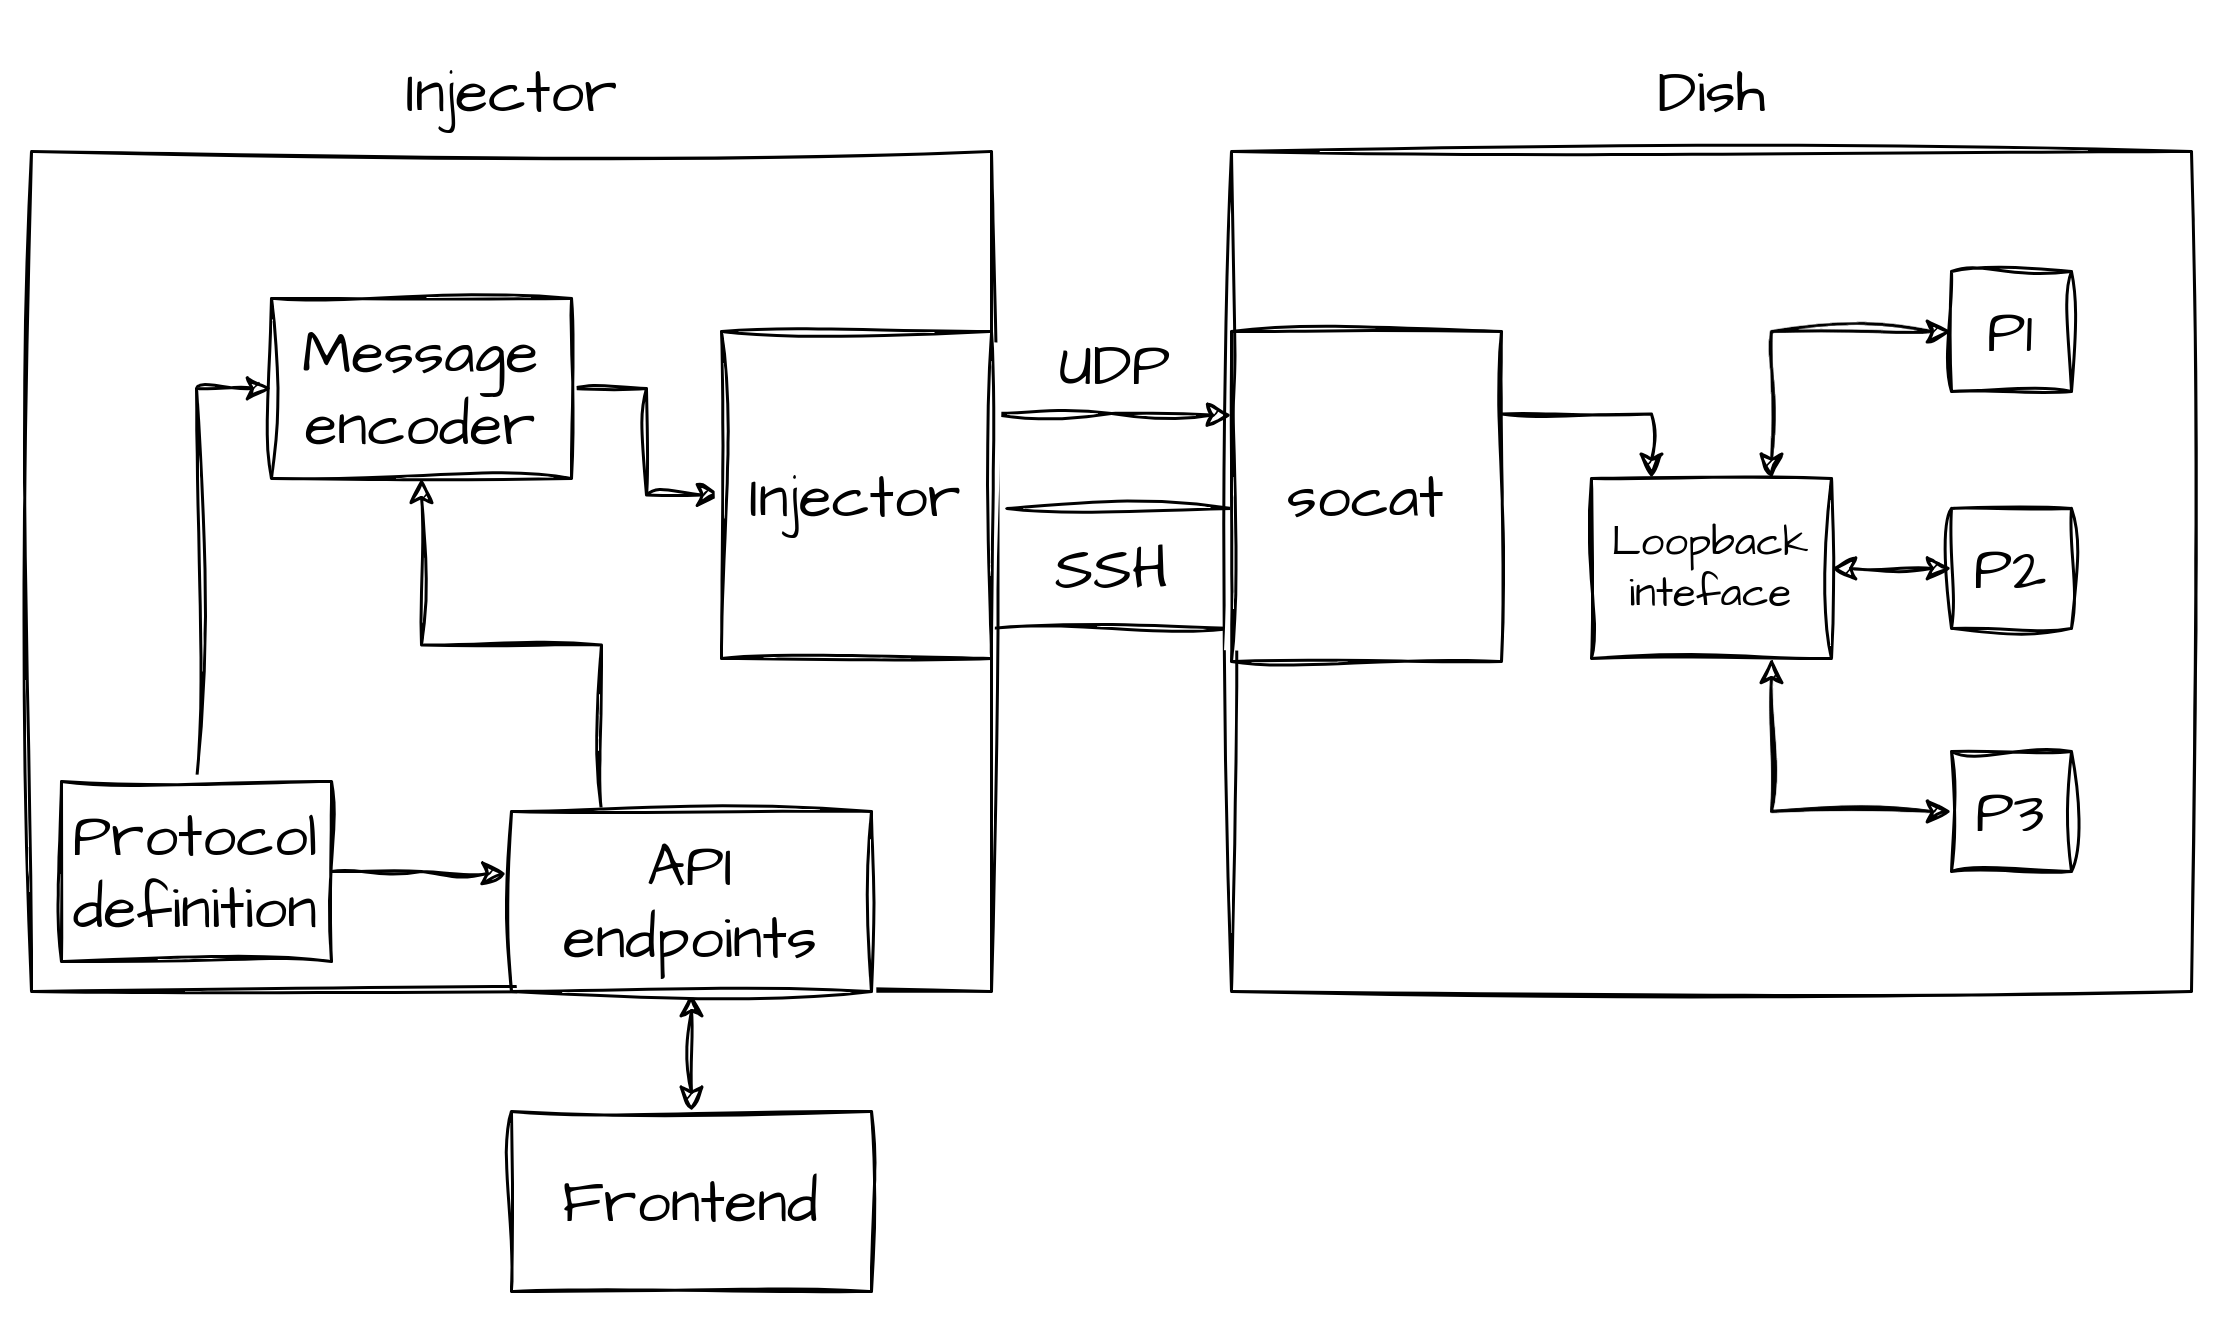
For this reason, we implemented the Slate injector, which shares most of the codebase with the sniffer.
The architecture of this tool is shown below.
Messages, to be received by processes, need to come from the loopback interface, thus we cannot send them directly from the Injector (which is external to the device).
This is why the injector will start a socat server on the dish, which will listen for UDP messages on the "external" network interface, and will then forward them to the right UDP port, by changing the source address to localhost.
Some API endpoints have been implemented to be able to inject messages from the front end and the current interface lets you edit and send a message or create a new one.
Being able to inspect messages between processes helped us a lot in understanding what each process does without being able to fully reverse-engineer them. Additionally, having the protocol definition and an easy way to inject messages, a natural development of the project is to fuzz the protocol, which will be tackled in Section fuzzing. The full code of the Slate sniffer, injector and fuzzer can be found here, but again without the protocol definitions, which you'll have to extract from the dish.
Fuzzing
In the last part of my internship at Quarkslab, we identified which parts of the software had been analyzed enough to be suitable for fuzz testing. To find a good fuzzable target, we had to take into account multiple aspects:
- The possible attack vector in the case a bug was found:
- Can the bug be triggered by an authenticated user?
- Does the attacker need to be connected to the Wi-Fi network of the dish?
- Can the bug be triggered directly from the Internet?
- Does the attacker need to already have access to the dish? In this case, the bug could be used for lateral movement inside the dish or privilege escalation.
- What is the impact of a possible bug in the target?
- How easily fuzzable is the target, and which kind of fuzzing is the most suitable for the target:
- How is the input provided?
- Can the target program run isolated? If a program makes use of many hardware peripherals and/or interacts with other components of the runtime, it will be hard to fuzz it in an isolated environment.
- How deeply have we analyzed the target to know its internal workings?
sxverity
As we saw in the communication section, it is possible to trigger a software update by sending a SoftwareUpdateRequest to the frontend process from the internal network.
This is an interesting request because it is the only one that does not look like it is meant for the user and does not require authentication.
Furthermore, the input of this request is the update bundle, which can be very big, while inputs for other requests are often empty or very simple.
The update bundle has to be split in chunks before being sent to the dish, here is a python script that sends this message.
CHUNK_SIZE = 16384

def update(data):
    channel = grpc.insecure_channel('192.168.100.1:9200')
    stub = device_pb2_grpc.DeviceStub(channel)

    stream_id = int.from_bytes(os.urandom(4), byteorder='little')

    for i in range(0, len(data), CHUNK_SIZE):
        chunk = data[i:min(len(data), i + CHUNK_SIZE)]
        request = device_pb2.Request(id = 1, epoch_id = 1, target_id = "unknown",
            software_update = common_pb2.SoftwareUpdateRequest(
                stream_id = stream_id,
                data = chunk,
                open = i == 0,
                close = i + CHUNK_SIZE >= len(data)
            )
        )
Every message needs to have the same stream_id, which can be randomly generated, then the first message has the open flag, while the last one has the close flag and all the ones in between don't have any of them.
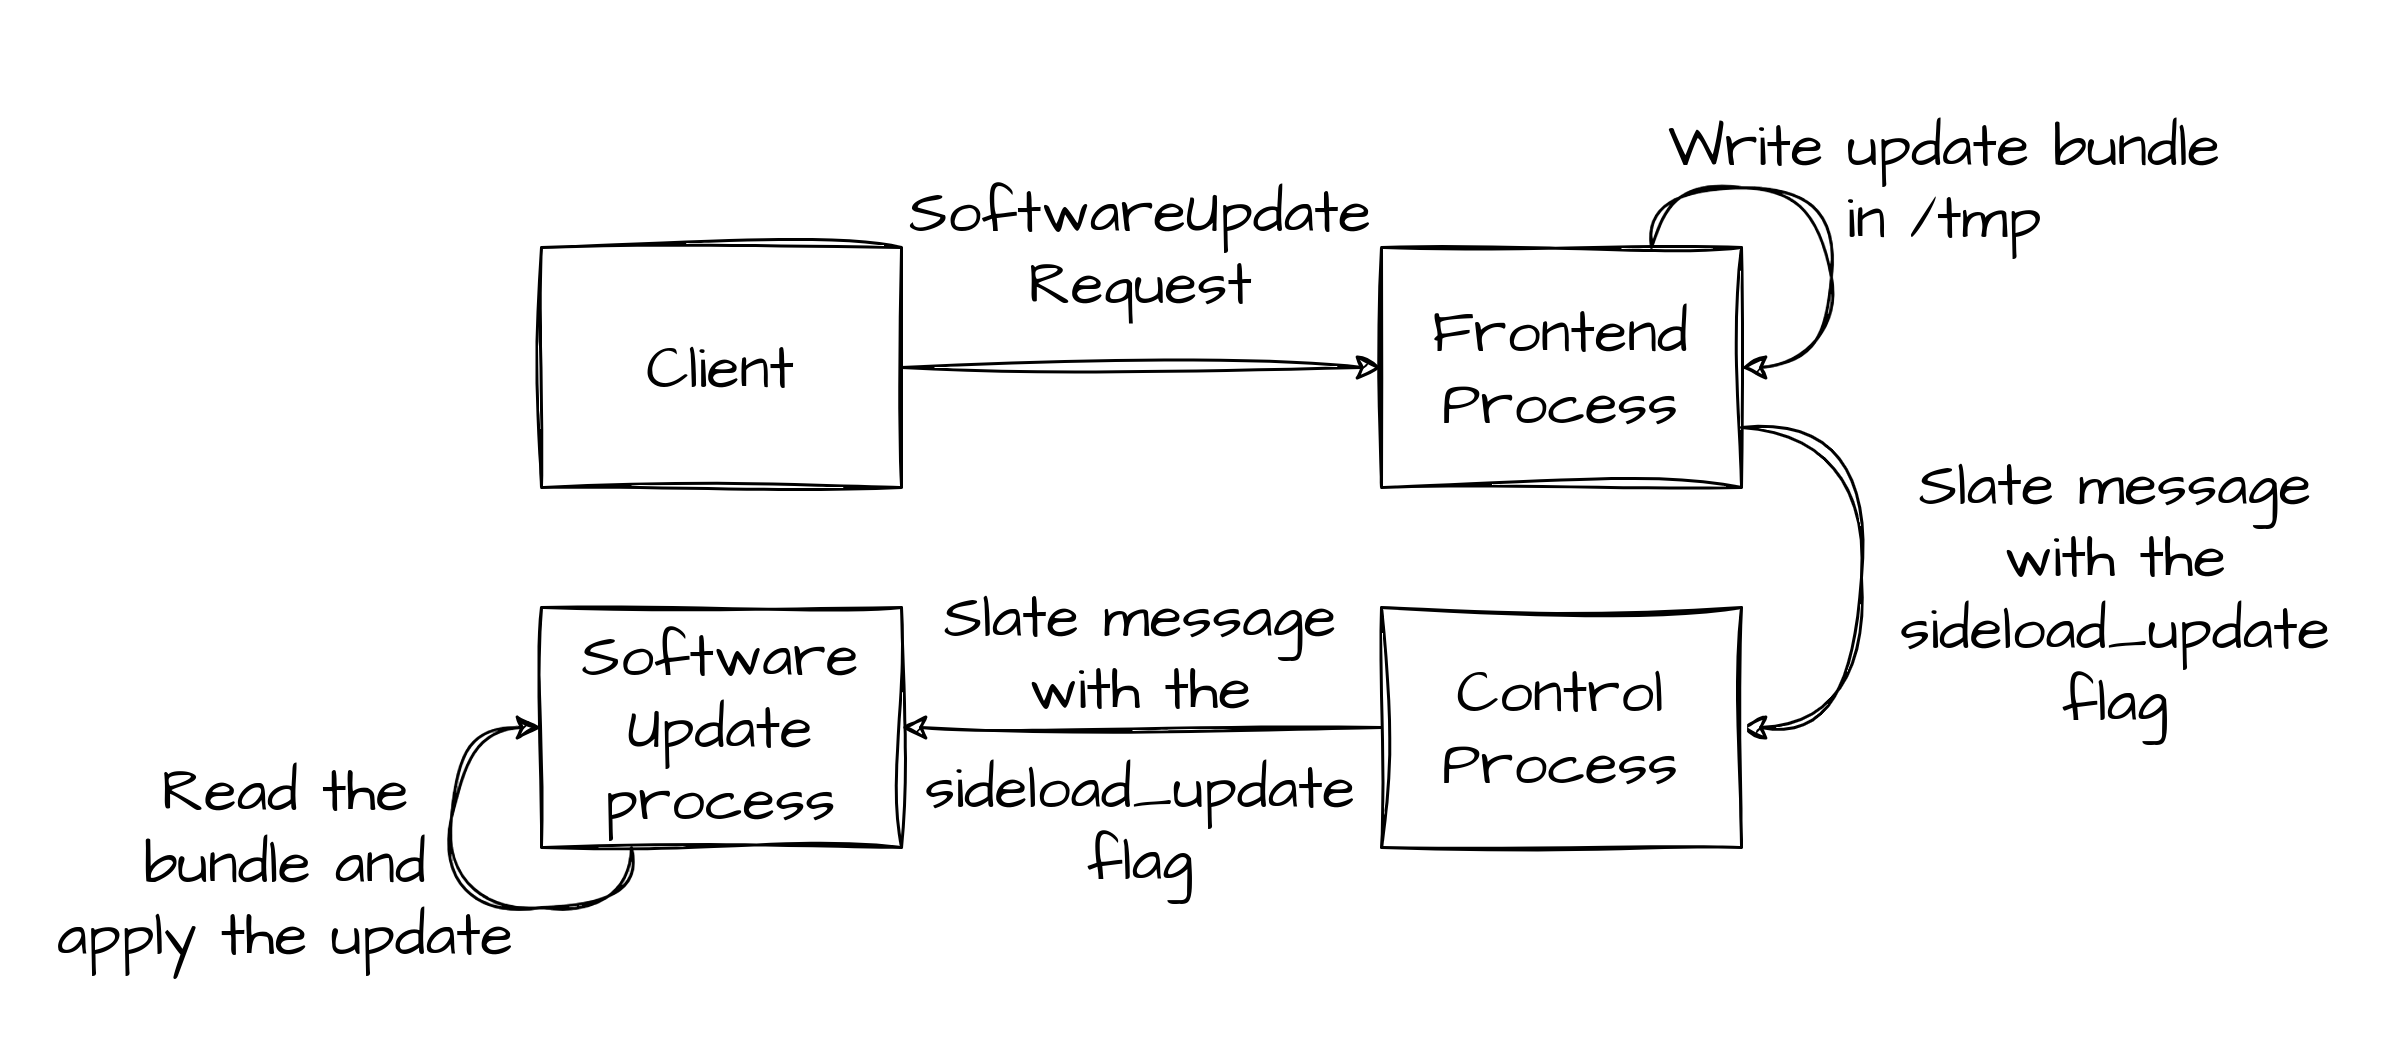
The receiver of the message is the frontend process, which will save the update bundle in a temporary folder, without reading the content of it, so without performing any kind of input sanitization, it will just check that the size of the bundle does not reach a hardcoded threshold.
After that, the frontend process will notify the control process that a sideload update is ready to be applied, through a Slate message, and the control process will do the same for the software update process.
Once the latter receives the message, the update is ready to be started, the figure below shows the overall flow of messages and actions the SoftwareUpdateRequest triggers.
After the software update process is notified that a software update bundle is ready to be applied, the update procedure starts.
From this moment, there is no difference between this kind of software update and the standard one, which is downloading the update bundle from Starlink's backend.
The update bundle is a sxverity image, which will be verified by the program with the same name and the inner rom1fs filesystem will be mounted.
Once mounted, the software update process will look for partition images in the mount point.
Every partition image will also have a SHA512 hashsum for additional integrity verification.
Finally, each available partition image will be flashed on the corresponding /dev/blk/other/* eMMC logical partition.
The update bundle is not accessed directly by the software update process, so the first process actually reading the content of the provided input is sxverity. Thus any fuzz test can be performed directly on that binary, skipping all previous steps.
In the following figure, you can see how the verification process is performed by sxverity.
The fuzzable code is very limited because the signature verification is made by a library, which is out of scope, and anything happening after a successful signature verification is to be considered unreachable for us because if we can reach that state, it means we were able to craft an update package that would be flashed so we don't need to find other bugs there.
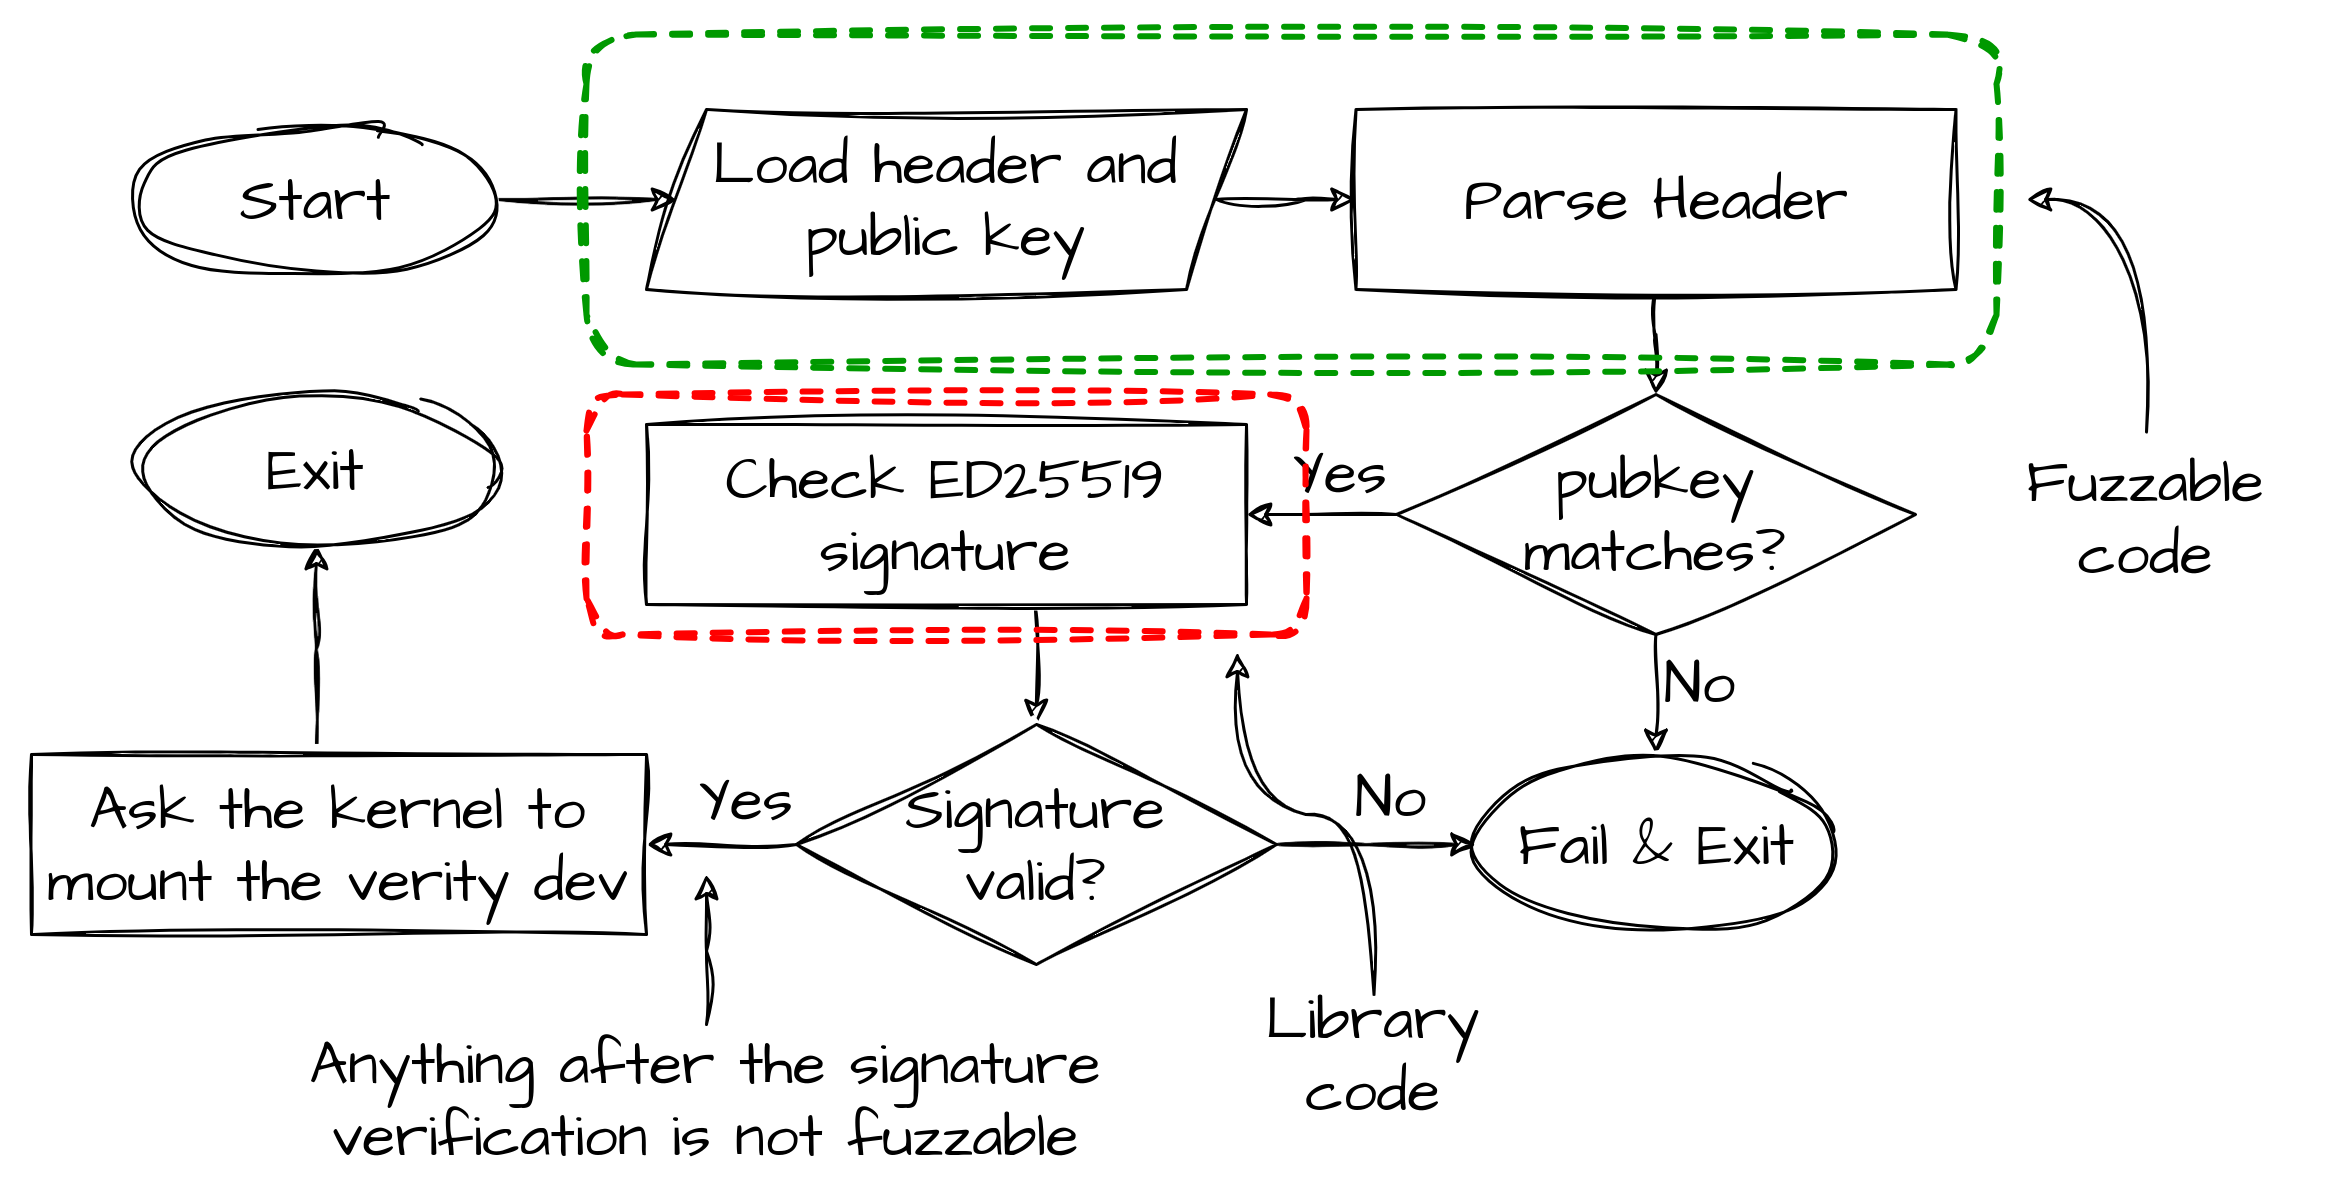
The only part of the input that will be parsed by the code under test is the header of the image, thus that will be the only part of the input that the fuzzer will mutate.
Since that part of the program can be executed completely in complete isolation, we've fuzzed it inside unicorn, a lightweight CPU emulator that can be instructed from Python, by using its bindings.
The first step was being able to emulate the code we want to test and setting up the harness for our fuzzer, which includes:
- Loading the binary.
- Identifying a good starting point in the code, in which it is easy to set up the whole environment, such as placing the input in the right memory location and setting up every other memory structure that will be used by the code under testing. As an example, the following snippet shows how the input is placed in memory and how registers holding the addresses to the input locations are set.
def place_input_cb(mu: Uc, content: bytes, persistent_round, data):
    content_size = len(content)

    if content_size < INPUT_MIN_LEN:
        return False

    pubkey, header = key_and_header_from_data(content)

    # write data in memory
    mu.mem_write(PUBKEY_ADDR, pubkey)
    mu.mem_write(HEADER_ADDR, header)

    # prepare function arguments
    mu.reg_write(UC_ARM64_REG_X2, PUBKEY_ADDR) # pubkey address
    mu.reg_write(UC_ARM64_REG_X3, 0x40) # nblocks
    mu.reg_write(UC_ARM64_REG_X4, HEADER_ADDR) # header buffer address

    return True
- Identifying function calls, hooking them and emulating them in Python, so that we do not spend time testing library code, nor do we have to load them in memory and handle dynamically loaded libraries.
As an example, here is how the libc function
memcpyis hooked and emulated.
if address == MEMCPY_ADDR:
    # read arguments from registers
    dest = mu.reg_read(UC_ARM64_REG_X0)
    src = mu.reg_read(UC_ARM64_REG_X1)
    n = mu.reg_read(UC_ARM64_REG_X2)

    # read the data from src
    data = mu.mem_read(src, n)
    # write data in dst
    mu.mem_write(dest, bytes(data))
    # return the address of dest
    mu.reg_write(UC_ARM64_REG_X0, dest)
    # jump to the return address
    lr = mu.reg_read(UC_ARM64_REG_LR)
    mu.reg_write(UC_ARM64_REG_PC, lr)
- Identifying an ending point, which has to be a point in the program in which we stop the emulation because the run was successful (no bugs).
The nicest thing about using Unicorn, other than being pretty easy to configure and instruct, is the flawless support with AFL++ (American Fuzzy Lop plus plus) which we used as fuzzer. AFL++ working with Unicorn can detect crashes and most importantly, gather coverage information, in a transparent manner, so that it can perform coverage-guided mutations and setting up the fuzzer with Unicorn is pretty straightforward. The fuzzer also needs some initial test cases, called seeds, for that we've used some valid headers, taken from sxverity images found in the dish, and some randomly generated headers.
The fuzzer ran for around 24 hours, performing more than one million executions, but unfortunately, no crash was recorded. This was expected since the tested codebase was very limited and the structure of the input was very simple, not having complex data structures or variable length fields, the most common memory-related bugs are avoided.
Slate messages
The other component we tested with fuzzing was Inter-Process Communication (IPC) - which was deeply analyzed in the previous section - since we already had developed a set of tools to analyze and tamper with this communication. In this case, we are not going to fuzz a single binary, but rather the whole set of processes that form the runtime of the device, since every one of them is using Slate messages to communicate. The fuzzing approach was completely different from the one we used for sxverity, which was gray-box fuzzing, because:
- The codebase we are trying to test is enormous.
- We weren't able to exactly identify the code that handles slate messages in every binary and, more importantly, bugs can be also found outside this code, because of some inconsistencies in the program state caused by wrongly interpreted inputs.
- Binaries need to run in a dish-like environment because they continuously interact with other components of the system, most of them don't even run in our emulated environment.
- Also recording coverage would have been challenging, because for that we need to instrument the binaries since we don't have the source code to recompile them, and the fuzzer would need to be run on the dish.
For the above reasons, we used black-box fuzzing, without coverage-guided mutations, which is usually called "dumb" fuzzing.
Boofuzz was used as fuzzer, it is a simple and easy-to-use fuzzer specifically designed for network protocols, which was a perfect fit for what we were looking for.
Boofuzz does not generate input in a completely random way because you are giving it the protocol definition to be used in the communication, with the possibility of defining sequences of messages using a finite state machine.
In our case, every message was disconnected from the others (apart from the sequence number), so defining the format of messages was enough.
The fuzzer will then mutate every field of the message, by trying some values that could trigger a bug, e.g. for an int32 the fuzzer will try values such as {0, 1, -1, INT_MAX, -INT_MAX, ...}.
As an example, here is how some fields of Slate messages are "translated" to Boofuzz protocol definition.
if param.dtype.name == "BOOL":
    return Simple(
        name=param.name,
        default_value=b"\x00\x00\x00\x00",
        fuzz_values=[b"\x00\x00\x00\x00", b"\x00\x00\x00\x01"],
    )
if param.dtype.name == "INT8" or param.dtype.name == "UINT8":
    return Byte(name=param.name)
if param.dtype.name == "INT32" or param.dtype.name == "UINT32" or param.dtype.name == "FLOAT":
    return DWord(name=param.name)
Every data type used in the Slate message protocol could be encoded using Boofuzz's standard types, apart from the Sequence number, which needs to store an internal state to increment itself every iteration, you can see its implementation in the following snippet.
Static fields such as the Bwptype and Crc can be encoded using the Static type from Boofuzz.
class SequenceNumber(Fuzzable):
    def __init__(self, *args, **kwargs):
        super().__init__(*args, **kwargs, fuzzable=False, default_value=0)
        self._curr = 0

    def encode(self, value: bytes = None, mutation_context=None) -> bytes:
        curr = self._curr
        self._curr += 1
        return int.to_bytes(curr, length=8, byteorder="big")
Once the message structure has been defined, the fuzzer can use the code from the Slate injector to send the messages.
The only component that needs to be implemented at this point is something that can detect if a program has crashed after a message was sent.
At first, we were issuing the pgrep command through SSH, but this was adding an overhead that was slowing the fuzzer.
So we've implemented a simple script that runs on the dish, opening a TCP socket and waiting for a connection which will then be used to directly communicate with the fuzzer.
The part of the process monitor that will run on the client (fuzzer machine) can be integrated into the fuzzer, by inheriting Boofuzz's BaseMonitor and implementing its methods, such as alive (check if the target process is still alive) and restart_target (restart the target process).
The resulting architecture is shown in the following figure.
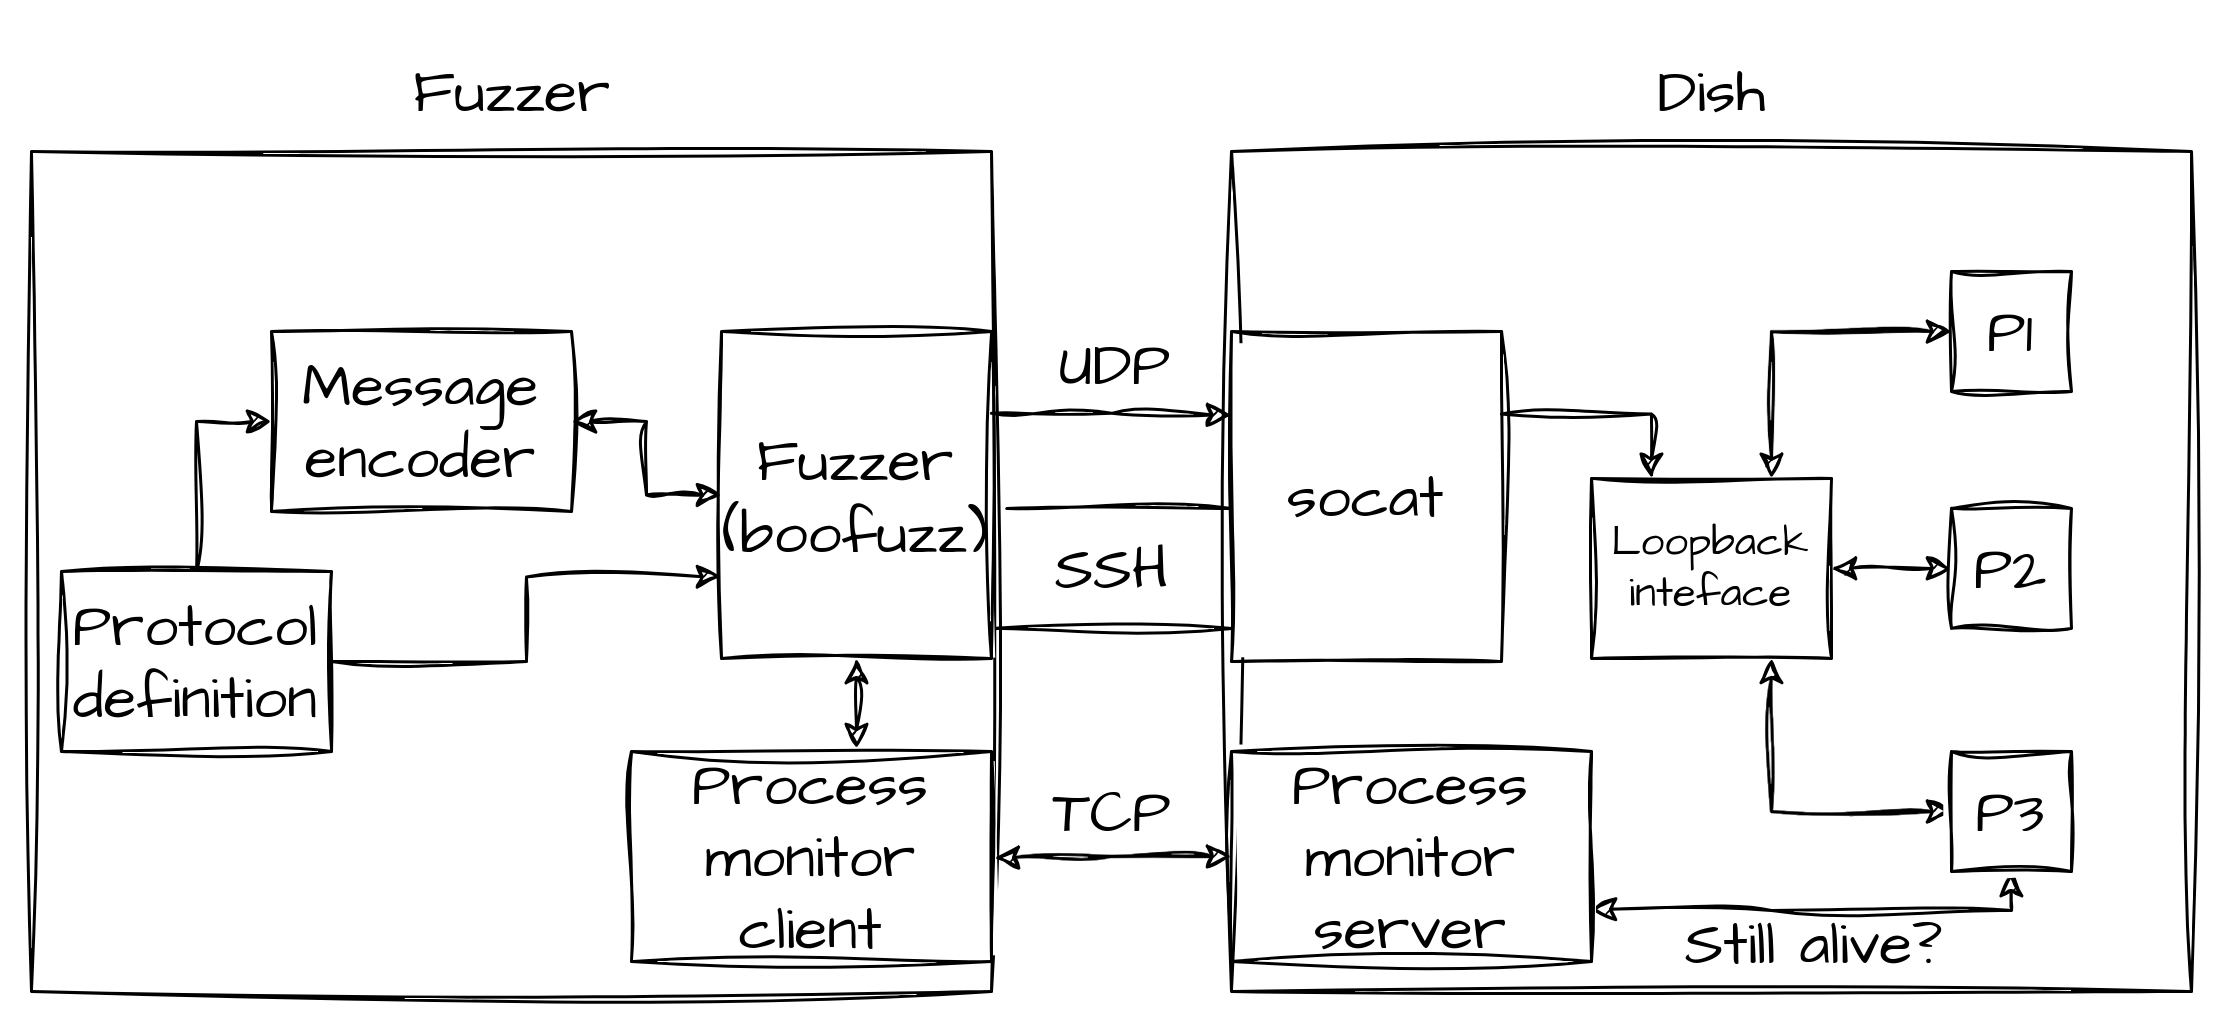
Some crashes were found by fuzzing the control_to_frontend protocol but none of them appeared to be exploitable in ways other than simply crashing the program, causing a Denial of Service for the frontend applications.
This is because the frontend process is a Go binary and the Go runtime makes the process crash (through the panic function) because it detects that something fishy is going on.
As an example, the following are the details of one of these crashes.
In the following snippet, you can see part of the stack trace produced by the Go runtime upon the crash, from which you can understand that the crash is caused by the function UpdateObstructionMap, which tries to allocate too much memory.
fatal error: runtime: out of memory

goroutine 5 [running]:
[...]
runtime.(*mheap).alloc(0x5046800?, 0x28234?, 0xd0?)
[...]
main.(*DishControl).UpdateObstructionMap(0x40003be000, {0x7a90f8?, 0x4000580380?})
[...]
By inspecting further this function, we understood how the obstruction map is transferred to the frontend process. First of all, the obstruction map is a 3D map of the sky above the antenna, indicating whether the antenna has a clear view of the sky or is obstructed by an obstacle such as a tree or other buildings, that the user can see from the frontend applications. This map is not produced by the frontend process, thus it has to be sent to it through Slate messages.
obstruction_map.config.num_rows                                                 uint32
obstruction_map.config.num_cols                                                 uint32
obstruction_map.current.obstructed                                              bool
obstruction_map.current.index                                                   uint32
In the snippet above you can see part of the message structure definition that carries information about the obstruction map.
The obstruction map is represented in memory as a matrix, in which each point can be obstructed or not.
The control process sends this information by sending one Slate message for each point in the matrix, by setting the right index and setting obstructed to true or false.
The size of the matrix is not fixed, and its dimensions can be set by the control process by using the num_rows and num_cols fields in the message.
This is where the bug resides, in fact when sending big values in these two fields, the program tries to allocate enough memory for the matrix and panics for this reason.
len = ObstructionMapConfigNumCols * ObstructionMapConfigNumRows;
if (len == (this->obstructionMap).snr.__count)
    goto LAB_0050b7f4;
(this->obstructionMap).numRows = ObstructionMapConfigNumRows;
(this->obstructionMap).numCols = ObstructionMapConfigNumCols;
puVar5 = runtime.makeslice(&datatype.Float32.float32,len,len);
The snippet above shows the decompiled and annotated code of the frontend binary which handles the size of the obstruction upon the reception of a slate message.
Line 1 computes the size of the matrix and line 2 compares it with the current size of the matrix the program has in memory, if the two differ then the dimensions are updated in the internal memory structure on Lines 4 and 5, and then the new matrix is allocated using the makeslice method of the Go runtime on Line 6.
As you can see, no checks are performed on the size to be allocated, nor on the result of the multiplication between the two given dimensions.
This would be very dangerous in C, but the Go runtime handles all the corner cases automatically, by checking that the size of the asked memory is positive and not too big.
The Go runtime also checks every array access, otherwise, an arbitrary write would probably be possible by playing with the index and the size of the matrix.
Note that this bug can only be triggered by sending crafted UDP packets to a service bound to localhost only.
Therefore it is not possible to trigger it from an external network.
Additionally, the iptables configuration of the UT filters out incoming UDP packets, so spoofing packets with a localhost source IP would not work either.
Therefore we did not consider this a vulnerability but merely a bug.
After we implemented the fuzzer and used it in the emulator, we were provided a rooted UT by Starlink, then we confirmed the presence of the aforementioned bug on a real device and fuzzed some more processes that weren't working in the emulator.
Conclusion
You can find more details in my master's thesis which will be published at the end of this year, stay tuned! The presented tools and script can be found in this repo.
This work and the tools we have published are meant to be reused for further research on Starlink's User Terminal. Unfortunately, due to some technical issues and time constraints, we did not manage to fully inspect the network stack and protocols used in the satellite communications, but hopefully, this knowledge base of the higher-level management function of the runtime can be used in the future to assist in that effort.
I encourage research on this topic also because SpaceX's security team is there to help you and they offer some juicy bounties.
Many thanks to:
- Maxime Rossi Bellom, my internship tutor, for guiding me in this research.
- Lennert Wouters, who was the author of the blog post regarding the dumping of the firmware and the fault injection attack of Starlink's User Terminal, for helping us in the early stages of this research.
- Tim Ferrell, from SpaceX's security team, for sending us a testing dish with root access.
- Ivan Arce, Salwa Souaf and Guillaume Valadon for reviewing my blog post.
- Many other amazing colleagues for helping me on topics in their fields of expertise.