Author Luigi Coniglio
Category Program Analysis
Tags tracing, dynamic analysis, synthesis, Triton, program analysis, 2019
Off-line dynamic trace analysis offers a number of advantages, which are illustrated in this blog post through several examples using internal tools we specially developed to automate trace collection and analysis.
Introduction
Dynamic program analysis consists in examining a program's behavior by processing information captured at execution time. Compared to static analysis, dynamic analysis unveils the actual behavior of a program and provides direct access to its execution flow and data. This is why dynamic analysis can be a powerful weapon when it comes to software reverse engineering (although it doesn't come without drawbacks).
Several dynamic analysis techniques involve program tracing followed by a trace analysis step.
In the case of on-line trace analysis, the information recorded is consumed right away (i.e. during execution), whereas in off-line analysis the execution trace is stored for later use.
In this article we briefly illustrate the advantages of off-line trace processing and present an internal tool for trace collection and analysis. Our tool is still experimental and therefore not yet ready to be published, we don't exclude however the possibility of a public release in the foreseeable future.
On-line vs off-line analysis
As briefly mentioned above, the workflow of tools using on-line trace analysis involves sending information collected at run-time directly to the analysis routine. The analysis routine will, in turn, consume the collected data as it arrives. In other words, the collector and the consumer run concurrently or are context-switched frequently. This is exactly what tools like Valgrind's memcheck [1] and ASAN [2] do.
In contrast, with off-line analysis, all information is stored in a file that is later loaded and consumed by the analysis routine.
Those two approaches are complementary and each one is best suited for different application areas. The main disadvantage of off-line analysis is that it requires to record and store an entire trace, which can turn out to be pretty big. However, when storing the traced information is a viable option, off-line analysis offers a considerable number of advantages:
It is portable since the analysis can easily be performed on a different machine than the one used to collect the trace.
A single execution can be used for several analysis routines given that all the necessary information is collected (e.g. very helpful in case of programs with a long startup time).
Analysis can be easily paused and resumed at any time without the need of spawning again a process.
The collected trace can be used for timeless debugging.
A framework for trace collection and analysis
At Quarkslab we always like to explore new ways of breaking software protections, and being able to perform complex dynamic analysis tasks is an essential part of our job.
In this article, we present some of our internal tools for the collection of execution traces and their off-line analysis, featuring:
qtracer: a configurable trace collector;
qtrace-db: a Python API to collect, read and manipulate execution traces;
qtrace-analysis: the trace analysis module, with several analysis routines.
qtrace-ida: an IDA plugin for the visualization of trace analysis results and timeless debugging.
The image below presents an overview of this tool:
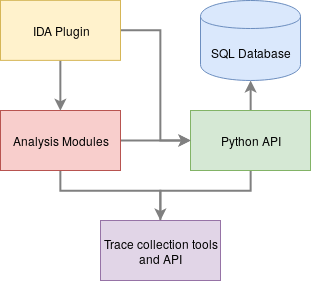
We developed this tool with portability in mind: all components but the collector are architecture-independent. The trace collector uses QBDI [3] and can be configured to collect runtime information such as the executed instructions, registers values, memory accesses and snapshots of memory regions. Furthermore, the Python API makes it easy to develop new collectors, for example using a debugger or other means of collection.
Throughout the rest of this article, we will present a couple of use-cases where trace analysis demonstrates to be a powerful approach when it comes to reversing obfuscated binaries. We illustrate this with the help of a couple of simple crackmes and Tigress [4], a well-known obfuscation tool.
Recovering the content of memory buffers
QBDI offers the possibility to monitor memory accesses and offers a simple API to retrieve the addresses and data read or written. In our trace analysis tool, we take advantage of this feature to (optionally) enrich our traces with memory accesses information.
The knowledge about the accessed memory can be used to recover memory content that would otherwise be unattainable using static analysis techniques.
Let us take as an example the following program:
1 2 3 4 5 6 7 8 9 10 11 12 13 14 15 16 17 18 19 20 21 22 23 24 25 26 27 28 29 30 31 32 33 34 35 36 37 38 39 40 41 | #include <stdio.h> #include <string.h> #define SECRET_LENGTH 12 int check(const char* input){ unsigned int i; unsigned int result = 0; const char* encoded_secret = "\x1a\x06\x08\x02\x03I\x03\x02R\x1c\x16\x01"; char decoded_secret[SECRET_LENGTH]; if (strlen(input) != SECRET_LENGTH) return 0; for (i = 0; i < SECRET_LENGTH; i++){ decoded_secret[(5 + i*7) % SECRET_LENGTH] = encoded_secret[i] ^ "trace me out"[i]; } for (i = 0; i < SECRET_LENGTH; i++){ result += decoded_secret[i] == input[i]; } return result == SECRET_LENGTH; } int main(int argc, const char** argv){ if (argc < 2){ printf("usage: %s <password>\n",argv[0]); return -1; } if (check(argv[1])){ puts("Congratulations!"); return 0; } else { puts("Ops..try again."); return -1; } } |
Here the function check compares the password given by the user with a secret which is statically encoded and embedded in the binary, and decoded only at runtime before the comparison occurs. Here recovering the decoded secret using static analysis would involve inverting the decoding algorithm.
Nonetheless, as you probably already noticed, the decoded secret appears in memory once the second for loop has terminated at line 19. Similarly to our example, it is not rare that, at some point, a software lets sensitive data appear in clear in memory for processing purposes.
In our specific case even a simple debugger would be enough to recover the content of decoded_secret However, our goal is rather to have a generic and automated approach to recover memory buffers exploiting the memory accesses dumped into the trace.
Here is a simple algorithm that extracts all memory addresses written in a given interval of instructions [X,``Y``]:
1 2 3 4 5 6 7 8 9 10 11 12 13 14 15 16 17 18 | write_accesses_list = write accesses from instruction X to instruction Y in reverse order saved_accesses = empty list for write_access in write_accesses_list { accessed_addresses = address of every byte accessed by write_access for address in accessed_addresses { if address is not marked { mark address } } if accessed_addresses contains at least a marked address { add write_access to saved_accesses } } |
After memory accesses have been listed, we can group adjacent memory accesses in saved_accesses thus reconstructing all buffers written in memory from instruction X to Y.
We implemented this algorithm (along with other memory analysis passes) in our internal tool. Coming back to our example, this is the result yielded by the aforementioned technique:
$ python solve.py
b'l\x17\xd0\xd1\xd7U\x00\x00'
b'\x0c\x00\x00\x00\xf2\x7f\x00\x004\x19\xd0\xd1\xd7U\x00\x00'
b'tracingisfun'
b'\x9a\x18\xd0\xd1\xd7U\x00\x00'
As we can see we were able to recover the decoded secret. The advantages of this approach are numerous. For example, a single trace can be used to recover memory buffers at any point during execution. One of the most interesting aspects is the possibility to use such a technique with little or zero prior knowledge about the binary under analysis: to solve the above crackme we had to look neither for the correct address of decoded_secret, nor for the point during execution where the latter contained the decoded secret. Still, the content of decoded_secret was automatically found and reconstructed by the analysis routine.
Extracting arithmetic predicates from an obfuscated binary
Let us consider the following crackme-style program:
#include <stdio.h>

int check(unsigned long pass){
    return pass * pass - 0x12345678 == 0xa0f6fc2adf0c4e8c;
}

int main(int argc, char** argv){
    long int code;

    printf("Enter security code: ");
    scanf("%ld", &code);

    if (check(code)){
        puts("Congratulations!");
    } else {
        puts("Try again!");
    }

    return 0;
}
Here the function check verifies a user-supplied security code with regards to some arithmetic constraint. Reversing such function is a trivial task for a reverser, so to spice things up we obfuscate it using Tigress' Virtualize transformation:
./tigress --Transform=Virtualize --Functions=check        \
    --out=obfuscated.c original.c
Tigress obfuscates the target function by transforming it into a specialized interpreter. The interpreter runs a precomputed set of virtual instructions corresponding to the behavior of the original function. As a result, this obfuscation technique hides the control flow and operations of the original function under an additional level of abstraction.
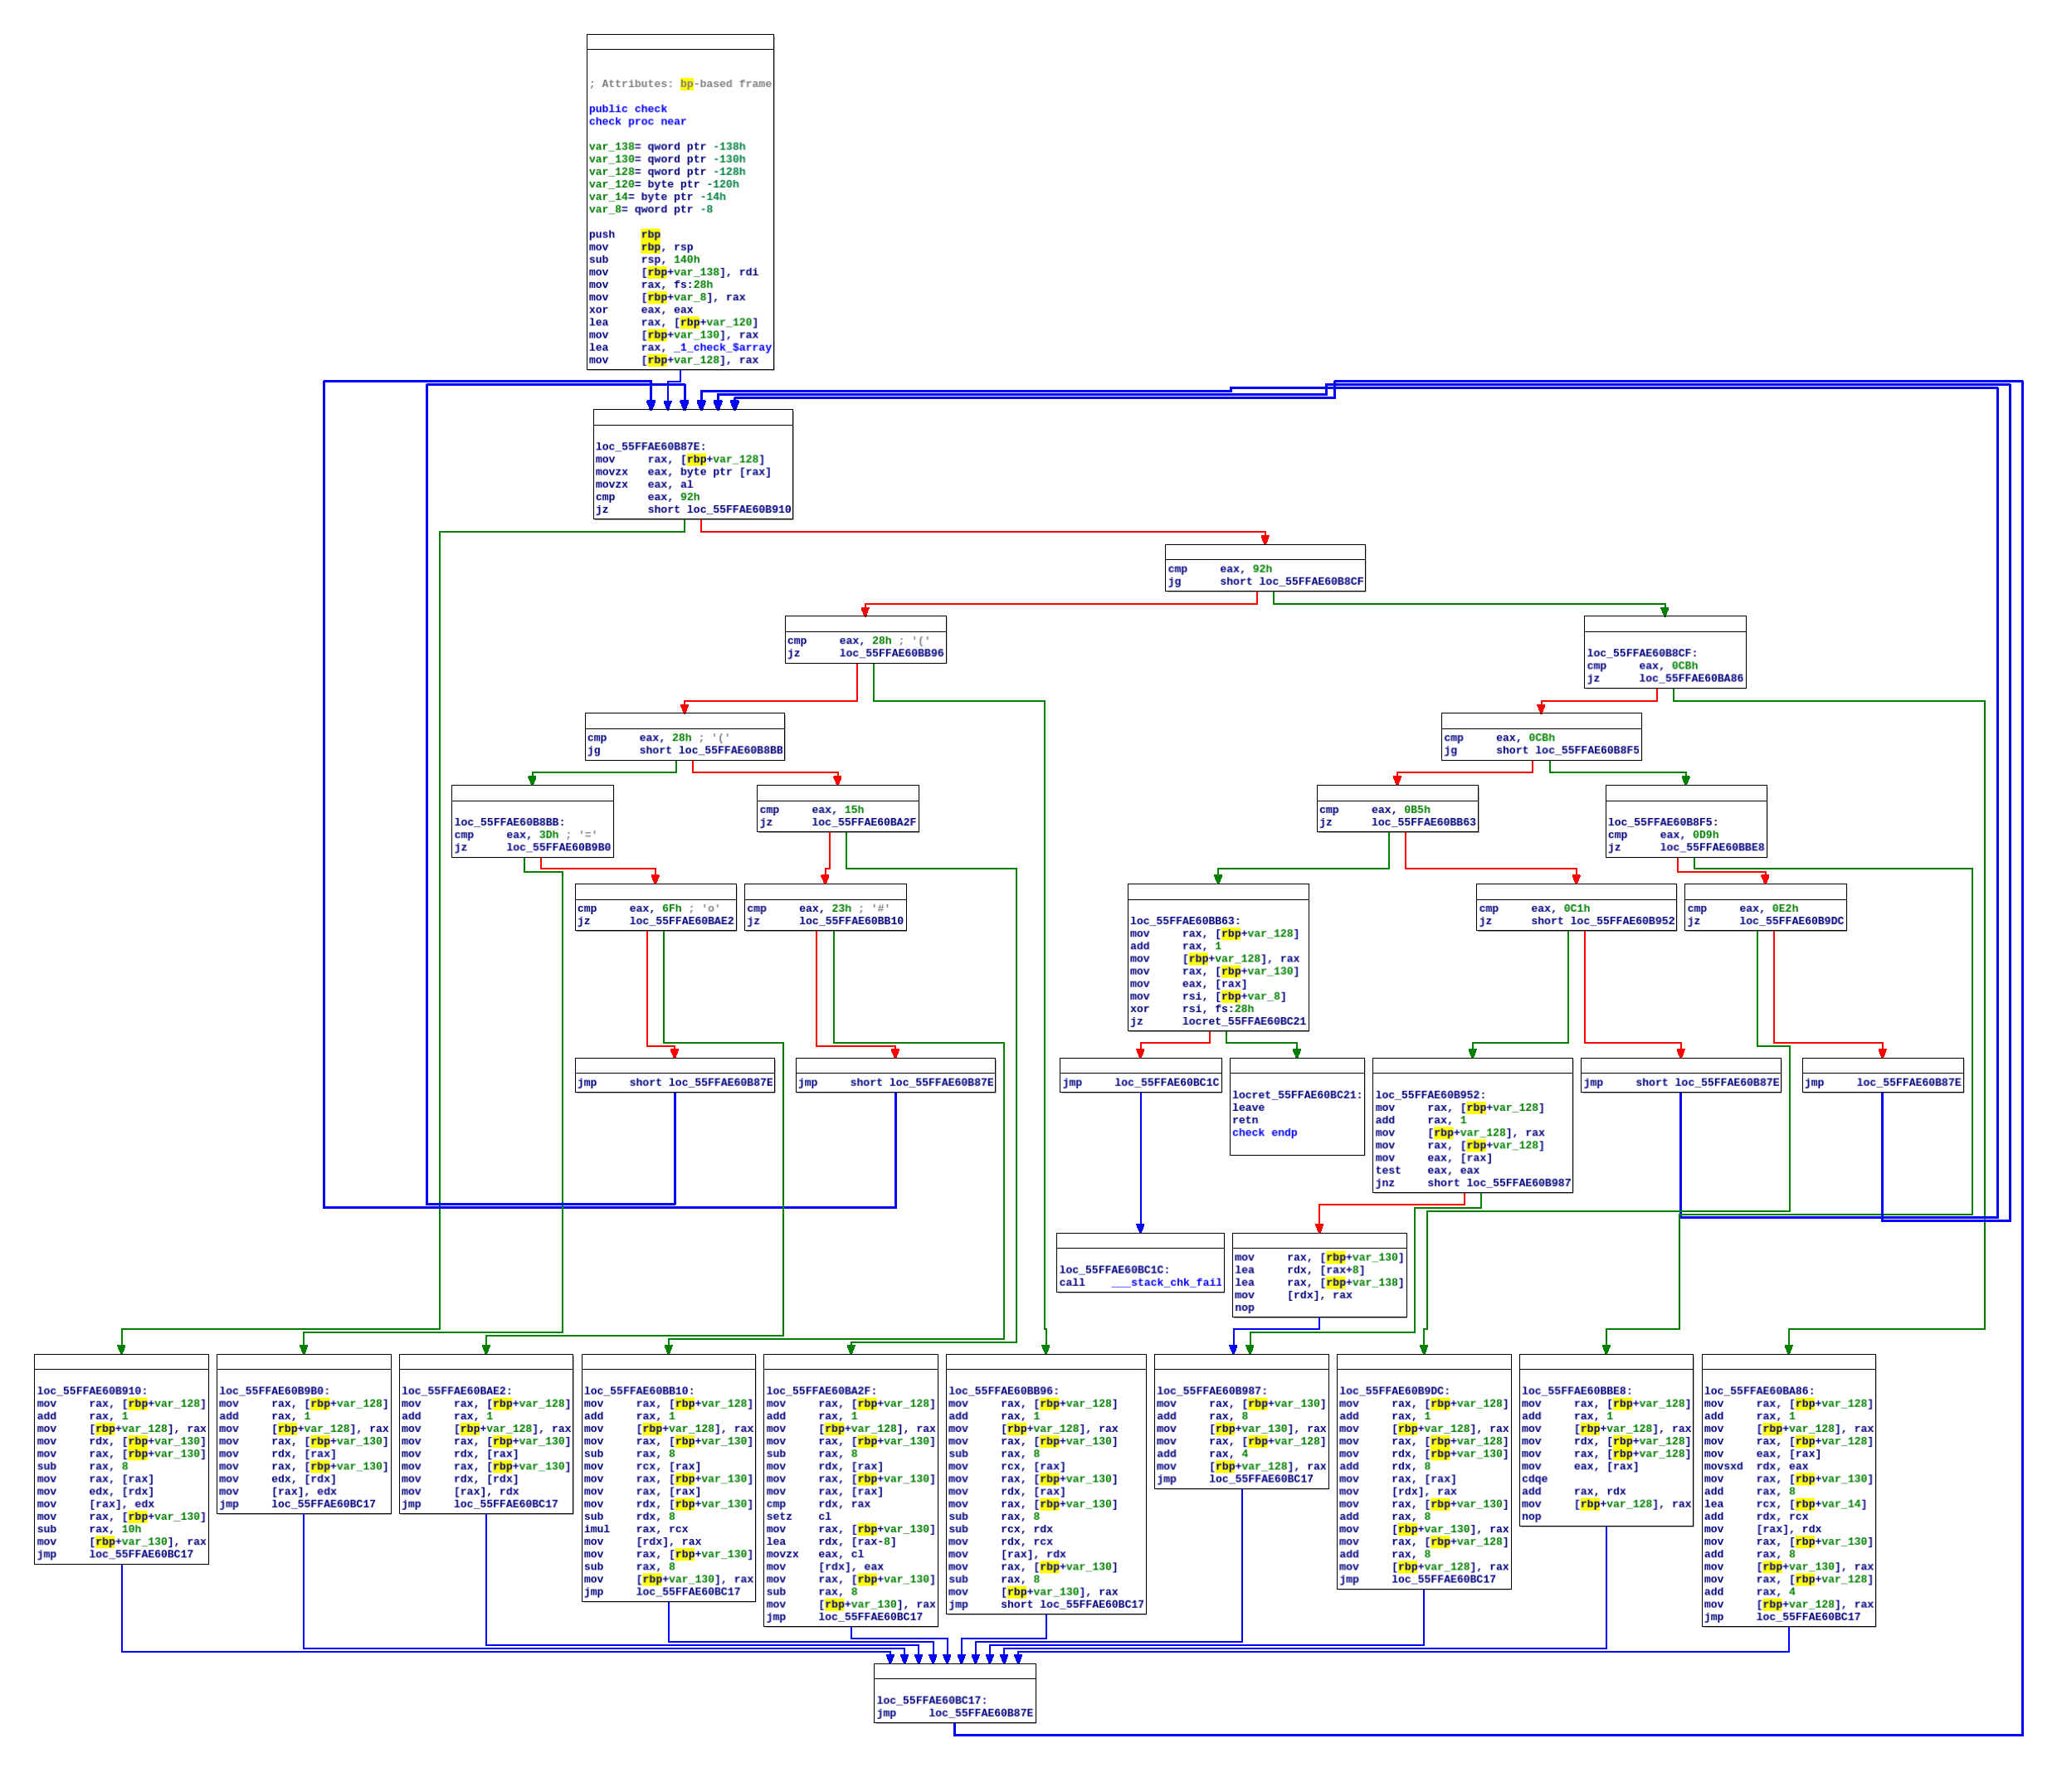
At this point the control flow graph of the function check looks like this:
We will now show how, using trace analysis, we can still easily recover the original operations performed by check. For this, we first collect an execution trace containing the executed instructions and the registers values. Using the trace it is possible to determine the exact execution flow and therefore which VM instructions are being executed and their order. Therefore, this includes also all the VM instructions not directly involved in the computation of the result of check.
To filter them out, we can perform a symbolic execution on the trace using a dynamic symbolic execution engine such as Triton [5] and recover the symbolic expression associated with the return value of check. Using Triton we can, in turn, retrieve which instruction was directly involved in the computation of such value, obtaining the so-called Data Flow Graph (DFG). The final result is cleaner than the one obtained by simple coverage-analysis since it filters out all unrelated VM instructions.
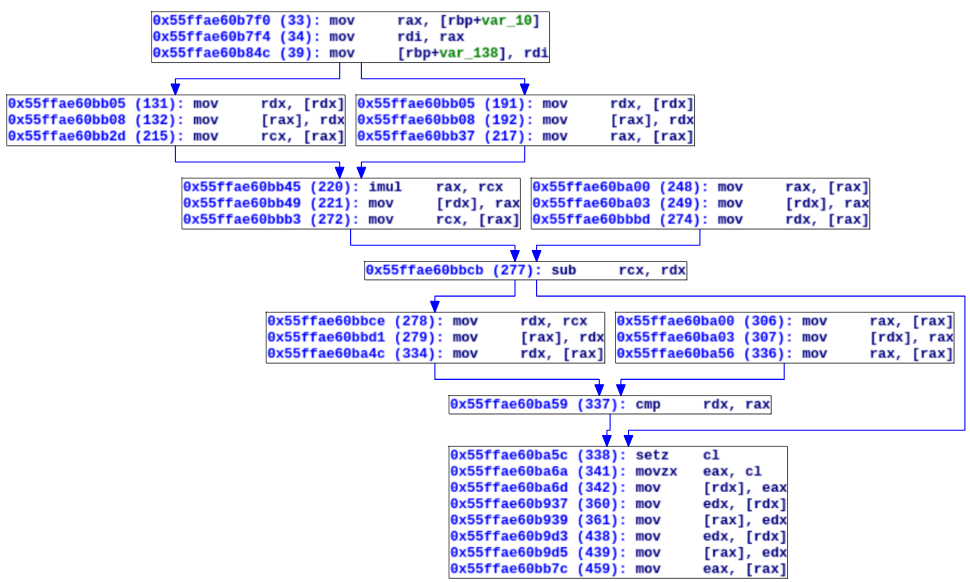
Here is the result displayed when asking our tool to build the DFG of RAX just after the function check has been executed:
This functionality is pretty similar to the UpGraph feature formerly proposed by SemTrax [6].
Here every instruction is prefixed with its address and a unique id between parenthesis, indicating that this is the n-th instruction in the trace. Following the DFG from top to bottom, we can rapidly reconstruct the original expression computed by the function check.
At Instruction 33 the value of our password is read, it is later multiplied by itself (Instruction 220) and a value is subtracted from the result of the multiplication (Instruction 277). Since our trace encodes register values we can obtain the value of a given register at any point in time. Using this information we can, for example, retrieve the value 0x12345678, used for the subtraction at Instruction 277. In a matter of seconds we are able to recover the original expression: pass * pass - 0x12345678. Finally, we can see that this value is later compared to another value (instruction 337) which turns to be 0xa0f6fc2adf0c4e8c.
Using synthesis to defeat MBA-protected VM instructions
To make our program resilient against the previous attack, we can harden the obfuscation by adding an EncodeArithmetic transformation:
./tigress --Transform=Virtualize --Functions=check    \
          --Transform=EncodeArithmetic --Functions=check  \
          --out=obfuscated.c original.c
As a result, this generates a virtualized binary in which each VM instruction has been obfuscated using mixed boolean arithmetic (MBA) expressions. This time the DFG looks like this:
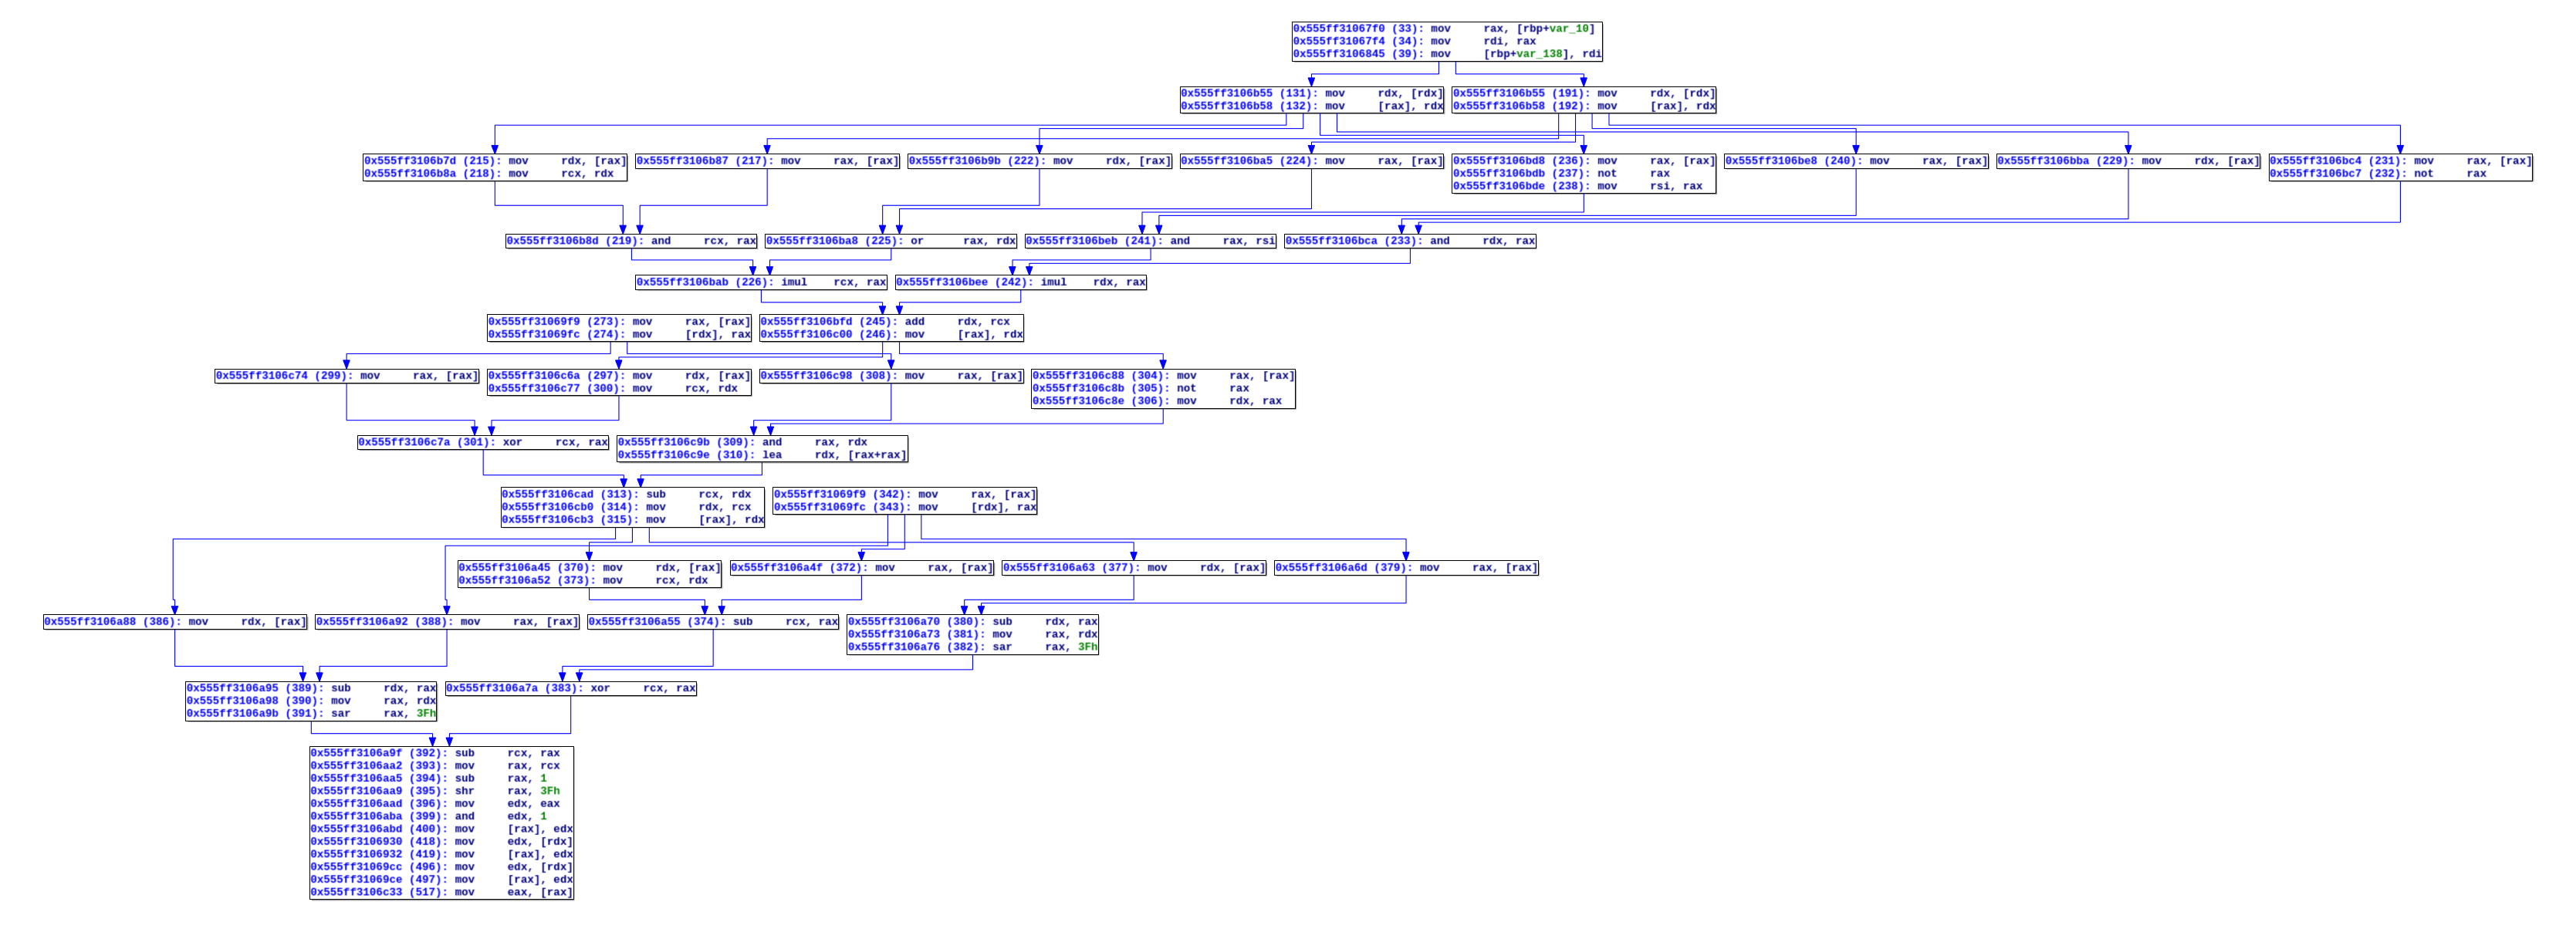
Unfortunately, this time the DFG doesn't unveil the original expression.
One possible way to retrieve it would be to recover, one by one, the operations performed by each VM instruction and then chain them together in the right order.
In our tool we implemented an algorithm to automatize this process and use program synthesis to recover each VM instruction. Program synthesis consists in deriving a program from a high-level specification, such as inputs/outputs pairs.
We take advantage of a version of Syntia [7] (an experimental program synthesis tool) specially modified for our needs. Syntia uses an heuristic search algorithm known as Monte Carlo Tree Search (MCTS) to find programs with an I/O behavior matching the given inputs/outputs pairs.
Here we show the result obtained by applying program synthesis to a carefully selected part of our trace including the target arithmetic expression.
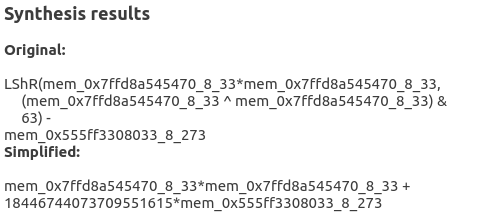
The original expression is the one directly obtained by the synthesizer while the simplified one corresponds to the original followed by a Z3's simplification step.
Let us examine the simplified expression. Here each variable corresponds to a memory read at a certain point in the trace and is named using the following format: mem_<address>_<size>_<instruction id>. The variable mem_0x7ffd8a545470_8_33 corresponds to our pass variable while the variable mem_0x555ff3308033_8_273 represents the constant value 0x12345678. The latter is multiplied by the value 18446744073709551615 (or 0xffffffffffffffff in hexadecimal form), thus inverting its sign. With this information we can now easily recover a good part of our expression: pass * pass - 0x12345678. A similar approach can later be used to recover the remaining equality.
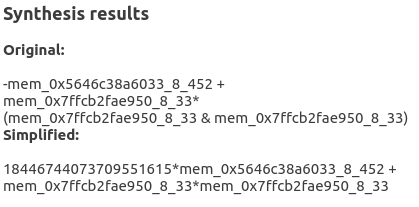
Symbolic execution and expression simplification could be a viable alternative to synthesis. In the above case this is the expression generated by simplifying with Z3 Triton's symbolic expression:
Here the expression generated by Z3 is less human-readable than the one generated using synthesis, however, it is reasonably short and can be understood easily.
Expression simplification, however, is limited by the size and complexity of the obfuscated expression while synthesis depends only on the complexity of the original expression.
We can push the obfuscation further by adding an additional EncodeArithmetic transformation:
./tigress --Transform=Virtualize --Functions=check    \
          --Transform=EncodeArithmetic --Functions=check  \
          --Transform=EncodeArithmetic --Functions=check  \
          --out=obfuscated.c original.c
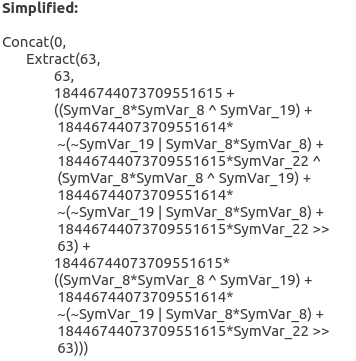
Here is Triton's symbolic expression simplified using Z3 after two EncodeArithmetic transformations have been applied to the program:
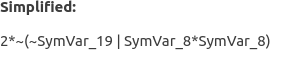
And here is the result yielded by program synthesis on the same execution trace:
Synthesis is a powerful weapon when it comes to reversing programs. We are currently working on better synthesis strategies and the technical aspects of this approach will probably be the object of a future blogpost.
Conclusion
In this blogpost we have explored the potential of trace analysis taking as an example a selection of the analysis routines implemented in our internal tool.
We must not forget however the limitations of this approach. Dumping a trace can rapidly become impractical for very large programs because of size constraints as well as the overhead introduced by the tracer (e.g. a DBI tool, or even worse, a debugger).
Analysis using symbolic engines suffers from the same limitations as the latter and are likely to fail when encountering some tainting and symbolic execution countermeasures. The blogpost Mistreating Triton illustrates some of those techniques.
Furthermore, analysis via program synthesis can easily lead to false results. This is because inductive methods such as the one proposed by Syntia [7] are unsound as they base their modeling on a selected subset of inputs/outputs samples. Therefore an additional verification step might be necessary to prove the equivalence between the synthesized expression and the original one and ensure soundness (this can be achieved using a SMT solver such as Z3).
References
| [1] | http://valgrind.org/docs/manual/mc-manual.html |
| [2] | https://github.com/google/sanitizers/wiki/AddressSanitizer |
| [3] | https://qbdi.quarkslab.com/ |
| [4] | http://tigress.cs.arizona.edu/ |
| [5] | https://triton.quarkslab.com/ |
| [6] | http://www.persistencelabs.com/blog/2014/12/9/introducing-semtrax |
| [7] | (1, 2) https://www.usenix.org/conference/usenixsecurity17/technical-sessions/presentation/blazytko |