In this blog post we discuss how to debug Windows' Isolated User Mode (IUM) processes, also known as Trustlets, using the virtual TPM of Microsoft Hyper-V as our target.
Introduction
A few months ago I wrote about two vulnerabilities I found in the TPM 2.0 reference implementation code. While trying to verify if the virtual TPM of Microsoft's Hyper-V was affected, I found that this virtual component runs as an Isolated User Mode (IUM) process, which means that it's not possible to attach a debugger to it, not even having elevated privileges. After looking for information on how to debug this kind of processes, I found slices of data scattered around the Internet, but no clear instructions about how to do it. After putting all the pieces together, I decided to write this in the hope that someone else doing research will find it useful.
Virtual Secure Mode and Virtual Trust Levels
Before even talking about IUM processes, it's mandatory to understand Virtual Secure Mode (VSM) and Virtual Trust Levels (VTLs).
Virtual Secure Mode is a set of hypervisor features that allow the creation of isolated memory regions where secrets are saved and sensitive code runs safely. VSM builds a new security boundary that restricts even code running in kernel mode from accessing the protected memory regions. VSM is what makes Windows security features such as Device Guard and Credential Guard possible.
VSM achieves isolation of protected memory regions via VTLs, which introduce two levels of trust that are orthogonal to protection rings: VTL0 is the Normal World, where the traditional kernel-mode and user-mode code run in ring 0 and ring 3, respectively. On top of that, a new world appears: VTL1 is the privileged Secure World, where the Secure Kernel runs in ring 0, and a limited number of IUM processes run in ring 3. Code running in VTL0, even in ring 0, cannot access the higher-privileged VTL1. With this architecture, even if an attacker manages to achieve kernel-mode code execution in the Normal World, the assets in the Secure World (such as the secrets stored in a virtual TPM, running as an IUM process in VTL1) remain uncompromised.
The following diagram taken from Microsoft's documentation illustrates the architecture described above, with the two privilege-separated VTLs having their own separate kernel-mode and user-mode.
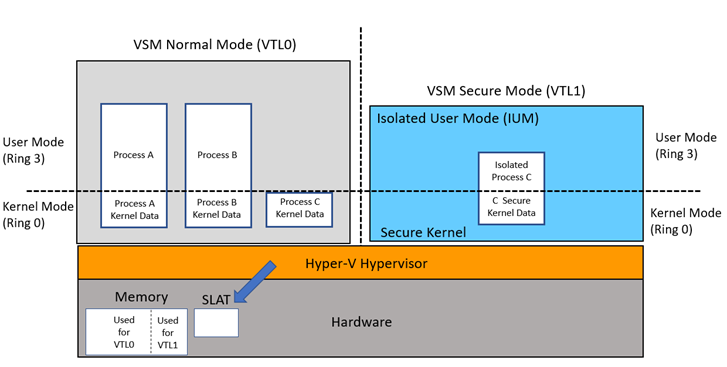
Image taken from https://learn.microsoft.com/en-us/windows/win32/procthread/isolated-user-mode--ium--processes
For a deep dive into Virtual Trust Levels, I strongly recommend reading A virtual journey: From hardware virtualization to Hyper-V's Virtual Trust Levels by Salma El Mohib.
Isolated User Mode processes
Finally, IUM processes are programs running in user-mode within VTL1. As such, they cannot be accessed from the Normal World. Typical examples of IUM processes are Hyper-V's virtual TPM, and the isolated version of LSASS (LSAIso.exe) when Credential Guard is enabled.
Nested virtualization setup
It is possible to debug Hyper-V's hypervisor by using a nested virtualization environment. Microsoft describes a procedure using two nested instances of Hyper-V and two instances of Windbg, but for some reason I didn't manage to make it work. So I resorted to an alternative solution: I used VMware Workstation to run a Windows guest (let's call it the Level 1 VM) with the Hyper-V role installed. This Level 1 VM, in turn, uses Hyper-V to run a nested Windows guest (let's call it the Level 2 VM), which has a virtual TPM device installed (the IUM process we want to debug).
By enabling the GDB stub of VMware workstation, we can attach the IDA Pro debugger to it. This allows us to debug the Hyper-V hypervisor running in the Level 1 VM. The following picture illustrates our setup:
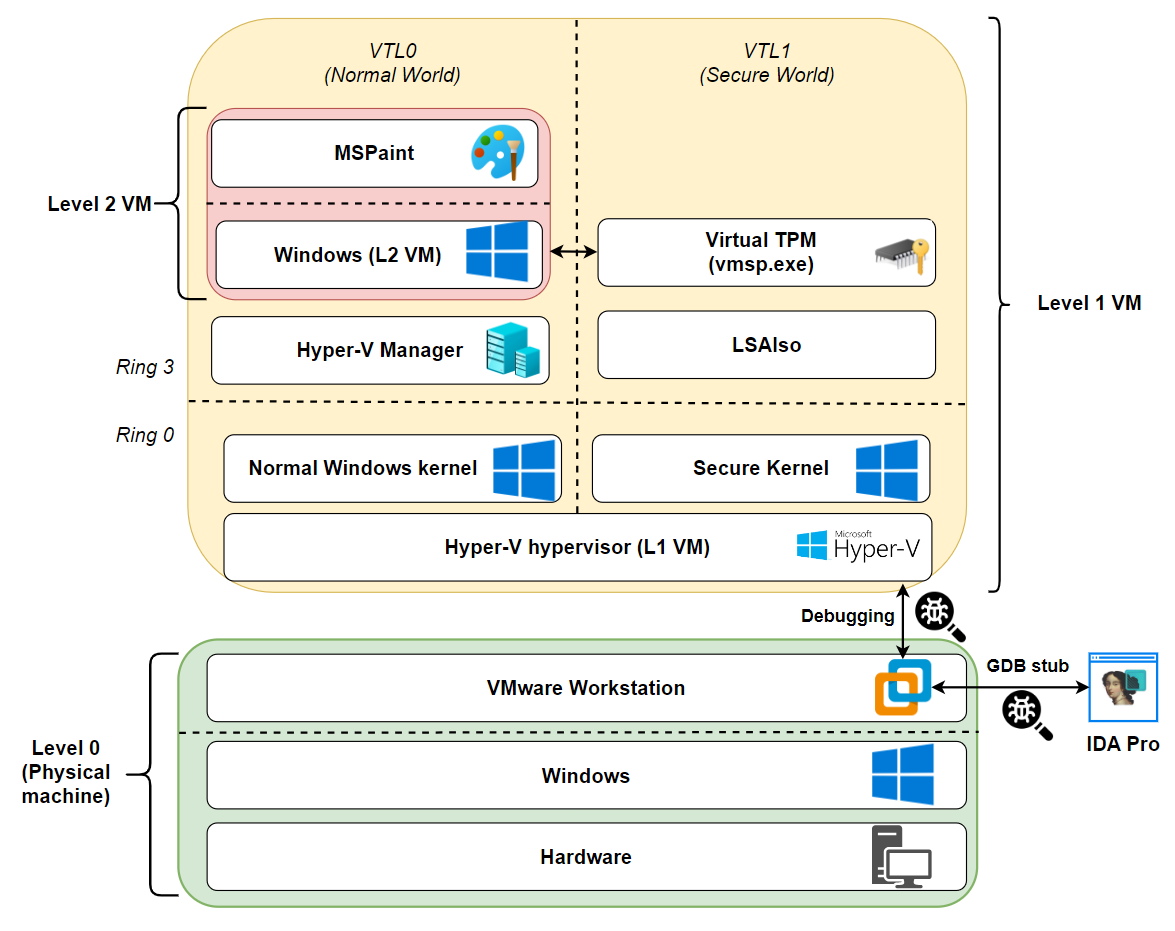
(Click to enlarge the image)
Overview of the process
This section outlines the steps we need to follow in order to debug an IUM process:
- Locate the handler for the
HvCallVtlReturnhypercall in the main hypervisor binary (hvix64.exe). - Attach the IDA Pro debugger to the VMware Workstation GDB stub. Determine the base address where
hvix64.exeis loaded. Put a breakpoint on the hypercall handler identified in Step 1. - When the breakpoint is hit, follow a series of Hyper-V structures to retrieve the value of the RSP register in the VTL1 context at the moment the hypercall was triggered.
- Convert the virtual address held in the RSP register to its corresponding physical address. Retrieve the return address stored at the top of the stack. This (virtual) return address points into the
SecureKernel.exebinary (the VTL1 kernel). - Convert the virtual return address to its corresponding physical address. Scan memory backwards looking for the
SecureKernel.exePE header to obtain the physical base address of this binary. - Patch the epilogue of function
SecureKernel!SkpsIsProcessDebuggingEnabledin physical memory to force it to always return1. This in-memory patch is what ultimately allows us to attach a debugger to an IUM process.
Locating the HvCallVtlReturn hypercall handler
An hypercall is a calling mechanism that a guest OS can use to invoke some functionality exposed by the hypervisor. The hvix64.exe binary I'm using here defines the handlers for 238 of them. There are no public symbols available for hvix64.exe, but the IDAPython script by Gerhart_x allows to easily identify the handlers for the supported hypercalls. Note that you may have to update this script to support newer versions, if needed.
We are interested in identifying the handler for hypercall 0x12 (HvCallVtlReturn). This hypercall generates a "VTL return", that is, when a higher VTL (VTL1) initiates a switch into a lower VTL (VTL0).
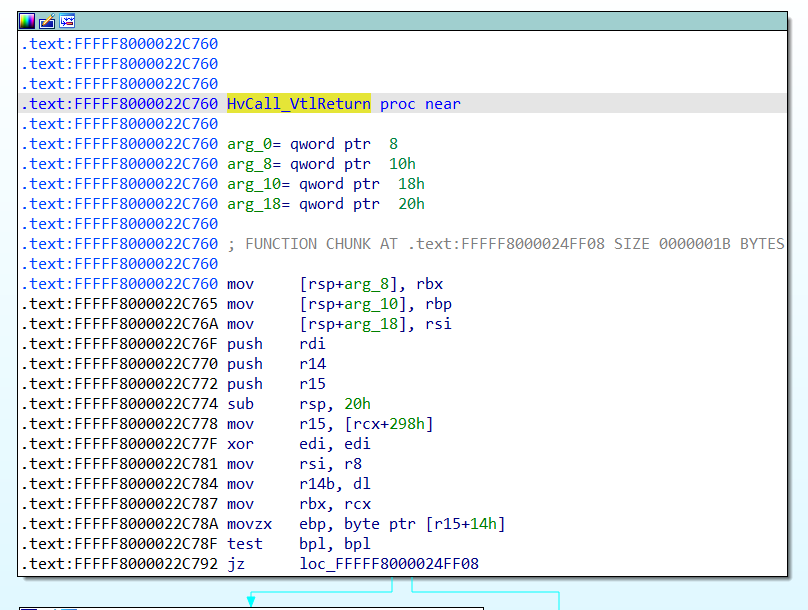
In the hvix64.exe binary I'm analyzing, the script locates our handler of interest at 0xfffff8000022c760:
Address of HvCallTable is  0xfffff80000c00000
Hypercalls count in file: 0xee
Windows 10 (20H1, 21H1)
entry 0x1: 0xfffff8000028e930 (HvCall_SwitchVirtualAddressSpace)
entry 0x2: 0xfffff800002235c0 (HvCall_FlushVirtualAddressSpace)
entry 0x3: 0xfffff80000221ad0 (HvCall_FlushVirtualAddressList)
entry 0x4: 0xfffff8000028f660 (HvCall_GetLogicalProcessorRunTime)
entry 0x5: 0xfffff80000290640 (HvCall_UpdateHvProcessorFeatures)
entry 0x6: 0xfffff8000028a560 (HvCall_SwitchAliasMap)
entry 0x7: 0xfffff80000290830 (HvCall_UpdateMicrocodeDatabase)
entry 0x8: 0xfffff8000021b950 (HvCall_NotifyLongSpinWait)
entry 0x9: 0xfffff8000028f880 (HvCall_ParkedLogicalProcessors)
entry 0xa: 0xfffff80000291000 (HvCall_InvokeHypervisorDebugger)
entry 0xb: 0xfffff80000220bb0 (HvCall_SendSyntheticClusterIpi)
entry 0xc: 0xfffff8000028de90 (HvCall_ModifyVtlProtectionMask)
entry 0xd: 0xfffff800002928e0 (HvCall_EnablePartitionVtl)
entry 0xe: 0xfffff80000292780 (HvCall_DisablePartitionVtl)
entry 0xf: 0xfffff800002929e0 (HvCall_EnableVpVtl)
entry 0x10: 0xfffff80000292830 (HvCall_DisableVpVtl)
entry 0x11: 0xfffff8000022d3f0 (HvCall_VtlCall)
entry 0x12: 0xfffff8000022c760 (HvCall_VtlReturn)
[...]
The script will take care of automatically renaming all the hypercall handlers. The handler function we are interested in will be renamed to HvCall_VtlReturn.
Debugging the hypervisor
By following the instructions detailed here it is possible to enable VMware Workstation's GDB stub to debug the Hyper-V hypervisor running in the Level 1 VM, using IDA Pro as our debugger.
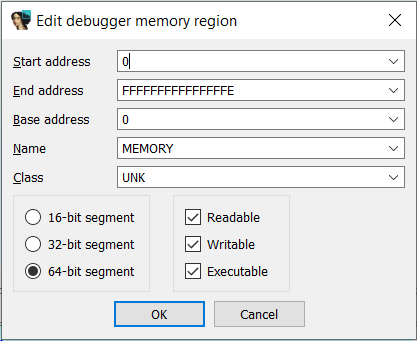
Once you have your IDA Pro debugger attached to the Hyper-V's hypervisor that is booting up inside VMware, IDA will warn you that the GDB stub doesn't provide information about the memory layout of the target, and as such, memory contents may be invisible.
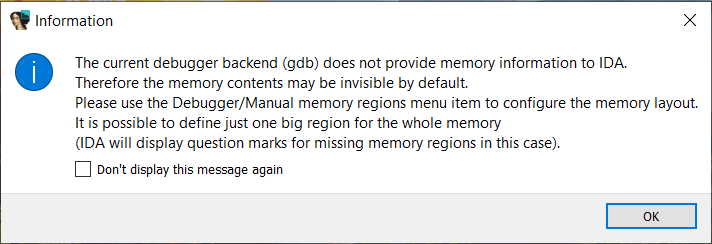
Due to this, you'll need to add a manual memory region, so that the debugger can access the whole address space of the debugee. For simplicity, you can open the Debugger -> Manual memory regions menu, and create a 64-bit area starting at address 0, and ending at address 0xfffffffffffffffe.
Next, you want to determine the base address at which hvix64.exe is loaded, in order to properly rebase your hvix64.exe IDB in IDA. For this step I'm using the IDA-VMware-GDB.py script by Dmytro Oleksiuk. This IDAPython script determines the base address of the kernel (the hypervisor in this case) by obtaining the address of the first Interrupt Service Routine in the IDT (which typically points to nt!KiDivideErrorFault when debugging a regular NT kernel), and then scanning backwards, aligned to a page size, looking for the PE header that should mark the start of the hvix64.exe module in memory.
Be mindful that when you pause your VM to run this script, if the current virtual processor happens to be executing in VTL0 context, the IDT could be the wrong one (i.e. it would have entries pointing to the regular NT kernel, not to the SecureKernel). In that case, try switching processors by means of the Threads window in the IDA Pro debugger, and run the script again. To avoid problems arising from a wrong IDT, I added some extra checks to the script to be sure that the PE header that it finds actually matches the PE header of the SecureKernel.exe binary.
After obtaining the base address of hvix64.exe, you can rebase your module in IDA. Before rebasing, and to prevent this process from taking forever, I recommend temporarily removing the huge memory area we previously added in the Manual memory regions window of the IDA debugger. Once the image is fully rebased, add back the huge memory region (from address 0 to 0xfffffffffffffffe), and put a breakpoint on hvix64!HvCall_VtlReturn.
Getting the base address of the SecureKernel
When the breakpoint at hvix64!HvCall_VtlReturn is hit, it means that the virtual processor (VP) that triggered this hypercall is currently in VTL1 context, trying to transition into VTL0. We also know that hypercalls are originated from kernel mode. So, when hvix64!HvCall_VtlReturn is hit, we know for a fact that this hypercall was invoked from SecureKernel.exe (the VTL1 kernel), and therefore the VP that made the hypercall must have pointers to the SecureKernel.exe module in its registers. The first obvious thing would be to check out the RIP register, however the VMCALL instruction that triggers the hypercall happens to be in a trampoline area outside of SecureKernel.exe, so the RIP register doesn't help us here.
In my tests, the trampoline to invoke the HvCallVtlReturn hypercall can come from two different variables: SecureKernel!ShvlpVtlReturn and SecureKernel!HvcallCodeVa.
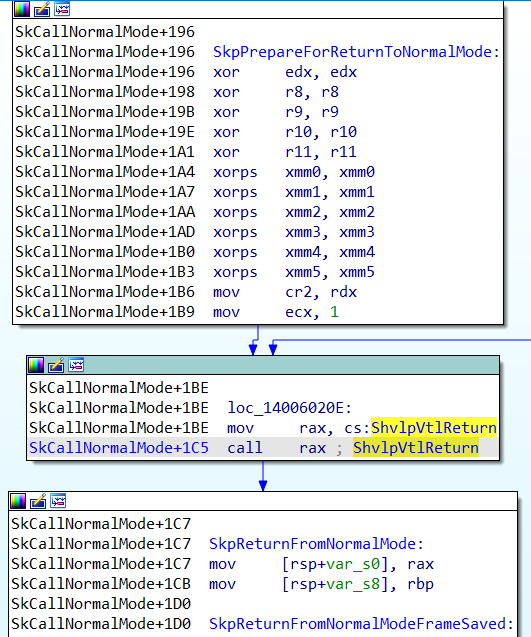
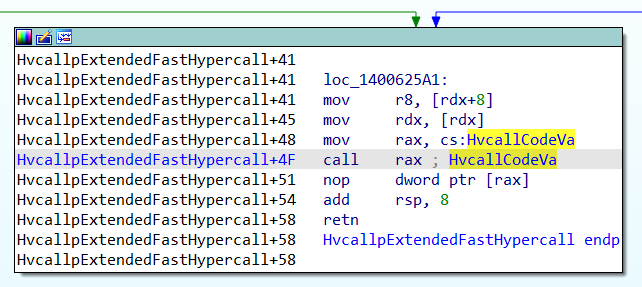
So, we need to try something else. Since the hypercall trampoline is invoked via a call (see the previous picture), we could obtain the value of the RSP register, and then retrieve the return address from the top of the stack, which should point to the instruction following the call rax depicted above (i.e. to SkpReturnFromNormalMode).
In order to retrieve the value of the RSP register of the current VP, we can follow a series of Hyper-V structures.
Finding the VMCS structure
From Salma's blog post we know that there's a number of important Hyper-V structures that are linked, such as Partition, VP, VTL, State and VMCS:
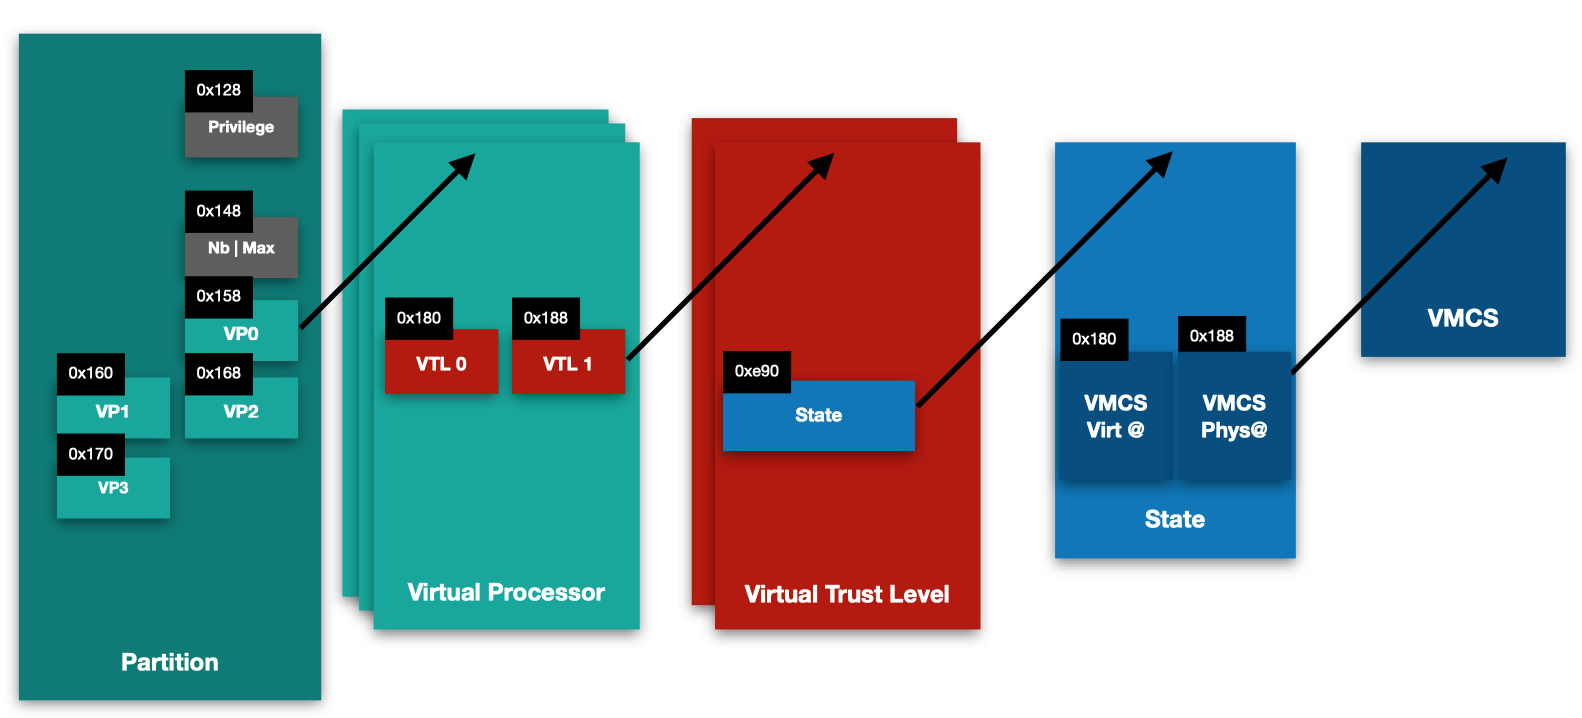
It's important to note that these are undocumented structures, and as such the offsets specified there can vary between Windows versions, and even between patch levels.
Our main goal is to locate the Virtual Machine Controlling Structure (VMCS), which holds important information regarding a virtual processor state, such as the values of the CR3, RIP, and RSP registers of the guest.
Salma's blog post shows that, in order to locate all these structures we need, it's a good idea to start by searching for occurrences of the vmptrld instruction, which loads the current-VMCS pointer with the physical address specified in the instruction operand. I found out that locating the following code pattern provides the easier way to figure out all the offsets we need:
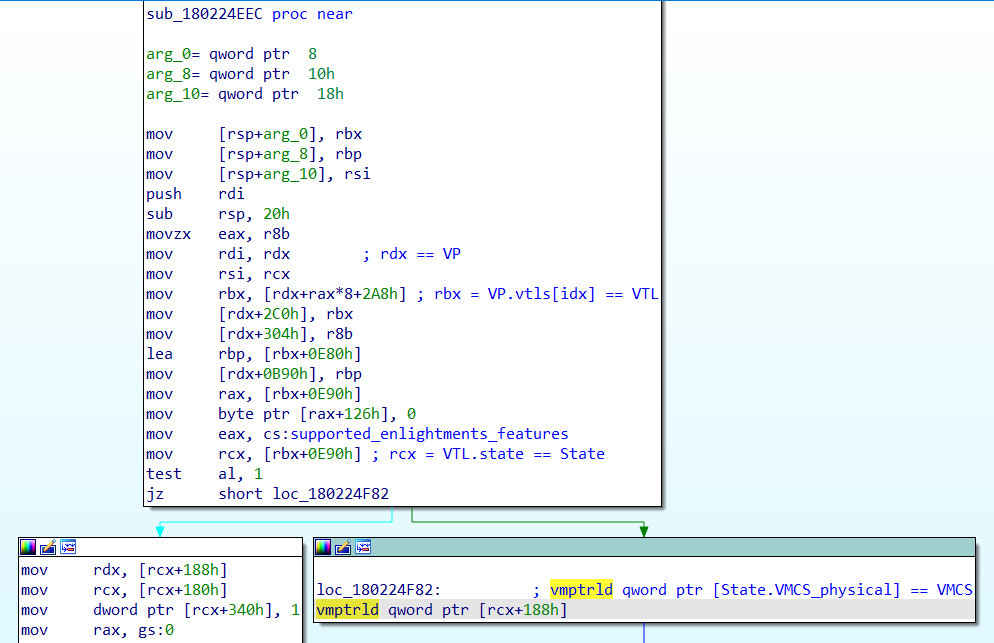
vmptrldloads the physical address of the VMCS from[rcx + 0x188]. From this we know thatrcxpoints to theStatestructure, and that the offset of theVMCS_physicalmember within theStatestruct is0x188.- If we backtrack the origin of
rcx(Statestruct), we can see that it comes fromrbx + 0xE90. So,rbxmust be a pointer to aVTLstructure, and the offset of thestatemember of theVTLstructure is0xE90. - If we backtrack the origin of
rbx(VTLstructure), we see that it originate fromrdx + rax*8 + 0x2A8. So,rdxis a pointer to aVPstructure, and 0x2A8 is the offset of the array of the twoVTLmembers (VTL0andVTL1).
In short:
VP + 0x2A8=VP.VTLs[0];VP + 0x2B0=VP.VTLs[1];VTL + 0xE90=VTL.State;State + 0x188=State.VMCS_physical.
NOTE: the offsets listed above may vary if you're analyzing a different version of hvix64.exe. Be sure to identify the proper offsets for your version of this binary.
I noticed that, when hitting the hvix64!HvCall_VtlReturn function, the initial value of RCX points to the VP structure. So, for our purposes, we will be able to follow the pointers to ultimately locate the relevant VMCS structure from this VP struct, without taking care of the first struct in the chain shown in the picture (Partition).
Finding RSP and CR3 registers within VMCS
We are searching for the value of the RSP register within the VMCS. But, since we'll want to convert some virtual addresses into physical addresses, we'll also need the value of the CR3 register to perform the page walk.
Starting from the initial value of RCX when the breakpoint at hvix64!HvCall_VtlReturn, we can follow the chain of pointers (RCX + 0x2B0 -> +0xE90 -> +0x188). You will notice that the last pointer in the chain (State.VMCS_physical) is, as expected, a physical address, unlike the previous pointers.
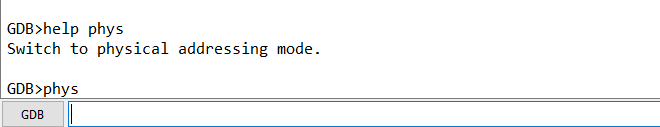
To follow this last pointer in order to inspect the VMCS, you need to use the phys command, to make the GDB monitor switch to physical addressing mode.
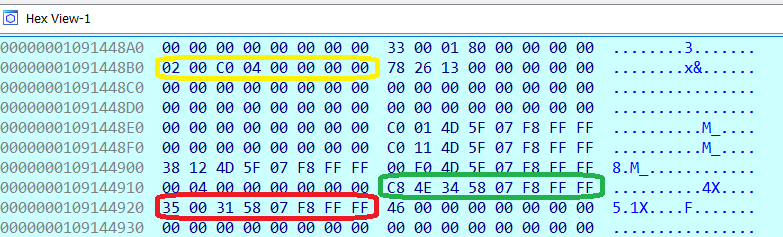
By exploring the layout of the big VMCS structure, I spotted the needed registers:
- CR3 register is located at offset
0x8B0(value0x04C00002, in yellow); - RSP register is located at offset
0x918(value0xFFFFF80758344EC8, in green); - RIP register is located at offset
0x920(value0xFFFFF80758310035, in red - highlighted for reference, not really needed).
NOTE: the offsets listed above may vary if you're analyzing a different version of hvix64.exe. Be sure to identify the proper offsets for your version of this binary.
Note that the RSP value is a virtual address, which makes sense in the VTL1 SecureKernel context that produced the hypercall, but not in the hypervisor we are debugging. In order to read the contents of that stack from the hypervisor, we need to translate that virtual address into a physical address.
Doing the page walk
To do the virtual-to-physical address translation of the RSP value, the typical page table walk must be done, starting from the physical address of the PML4 table, which is stored in the CR3 register that we just obtained from the VMCS in the previous section.
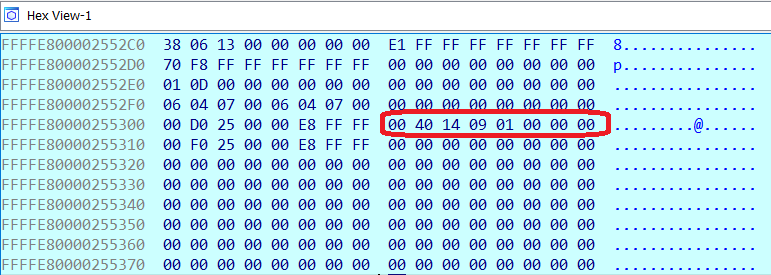
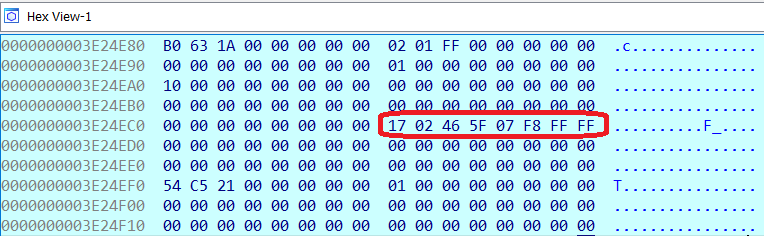
In the example from the previous section, the value of the RSP register was the virtual address 0xFFFFF80758344EC8, which gets translated to physical address 0x3e24ec8. By inspecting that physical address we observe that the return address stored at the top of the stack is the virtual address 0xFFFFF8075F460217.
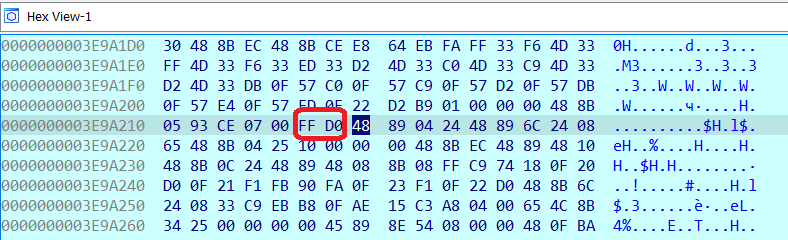
We translate this (virtual) return address 0xFFFFF8075F460217 to a physical address again, and the result is physical address 0x3e9a217. The 2 bytes right before the return address are 0xFF 0xD0, which can be disassembled as CALL RAX, meaning that we are on track.
This return address should already be a pointer somewhere within the SecureKernel.exe binary, more likely to an instruction following an indirect call to a trampoline that performed the hypercall. To locate the base address of SecureKernel.exe in a generic way we can simply scan memory backwards, in a page-aligned manner, looking for the PE header that should mark the start of the SecureKernel.exe module in memory.
Enabling debugging
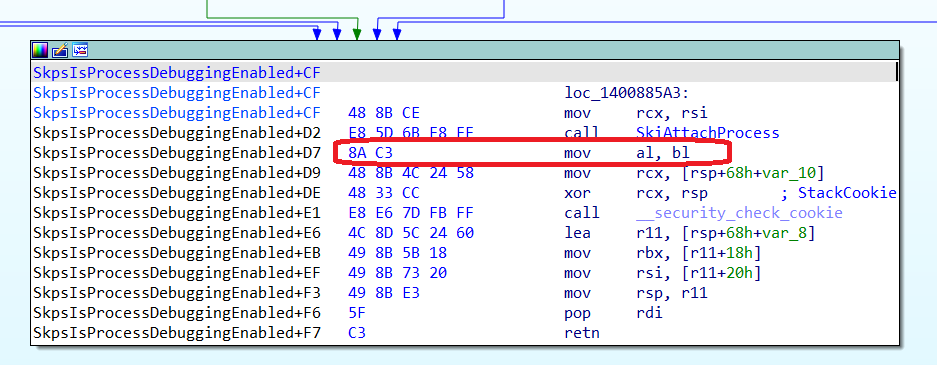
We have located the base physical address of SecureKernel.exe. The last step is to modify the Securekernel!SkpsIsProcessDebuggingEnabled function, which decides if debugging is enabled for a given IUM process, in order to make it always return 1. The simplest solution is to patch the function epilogue in physical memory, replacing the mov al, bl instruction at the end by a mov al, 1.
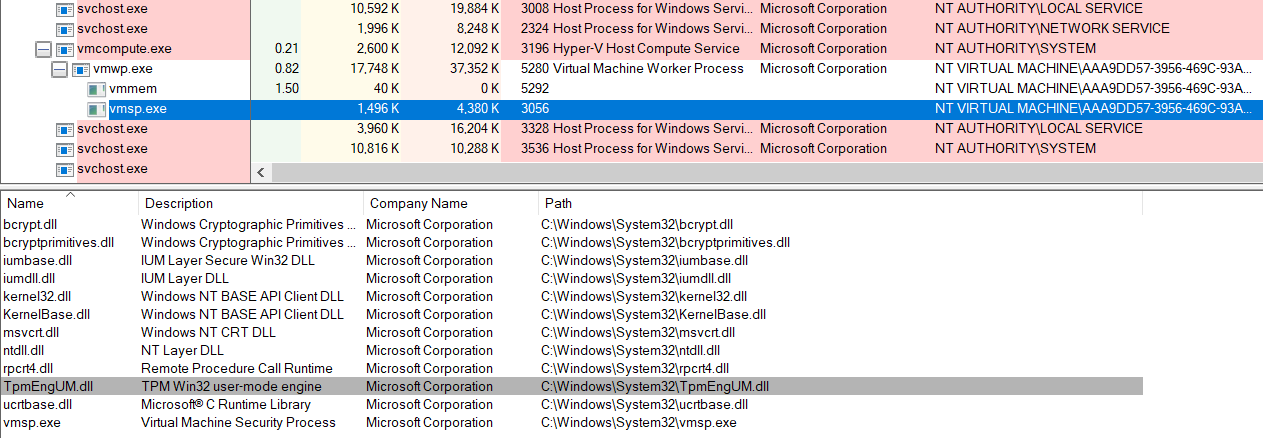
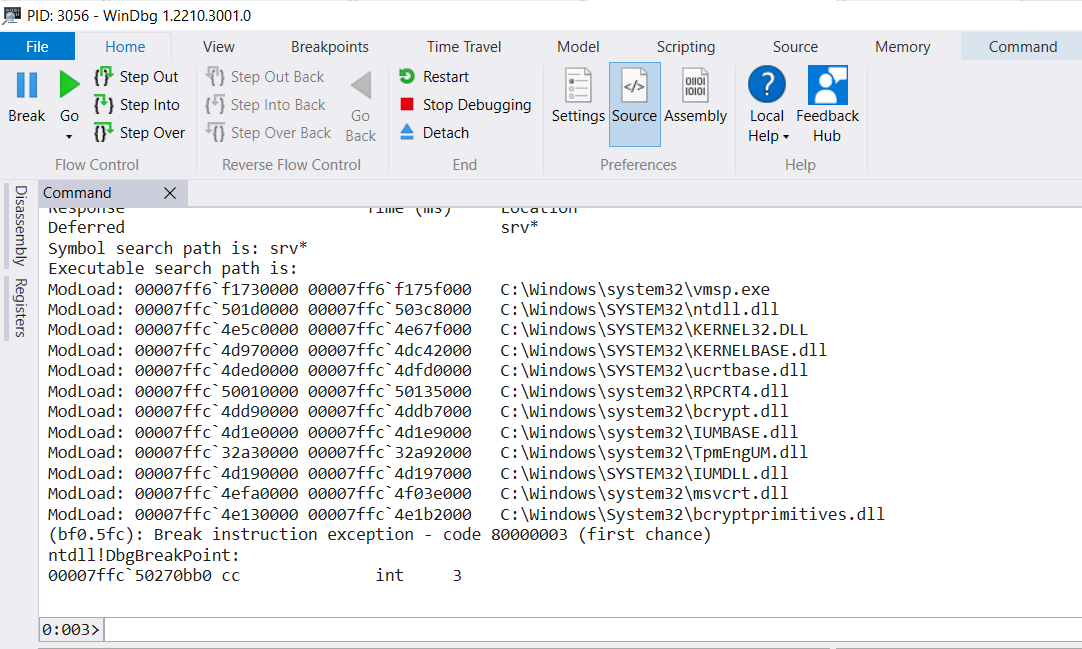
Finally, after that, we can attach a debugger to our IUM process (vmsp.exe in this case, the Virtual Machine Security Process, which hosts the TpmEngUM.dll library that implements Hyper-V's virtual TPM).
References
The following resources were very helpful when trying to figure out all the steps needed to enable debugging of IUM processes.
- A virtual journey: From hardware virtualization to Hyper-V's Virtual Trust Levels
- First Steps in Hyper-V Research
- Hyper-V debugging for beginners. 2nd edition
- Debugging Secure Kernel
- Fractured Backbone: Breaking Modern OS Defenses with Firmware Attacks
- Virtualization Based Security - Part 2: kernel communications
- Battle of SKM and IUM - How Windows 10 Rewrites OS Architecture
Conclusions
The purpose of this blog post was to describe in detail how to debug a IUM process (also known as Trustlet), using a combination of the IDA Pro debugger and VMware Workstation as a way to debug Hyper-V's hypervisor. This can be useful if you want to do research on this kind of processes, such as Hyper-V's virtual TPM, or the isolated version of LSASS implemented by the Credential Guard security feature.