Author Jonathan Salwan
Category Program Analysis
Tags source code analysis, Clang, program analysis, 2014
We recently began to work on source code analysis and the main objective was to easily collaborate on a same analysis. So, we started to develop a framework based on Clang that will be described in this blog post.
1 - Introduction
There are many goals of source code analysis:
Security review
Bug finding
Program verification / understanding
Type / Style / Property checking
But, for each of these goals, when we work on source code analysis with colleagues, the main issue is how we can manage to work together and centralize information. There are a lot of libraries for source code analysis but none of them shares nor stores data and related meta-data.
That is why, we created SCAF, a framework based on Clang which helps us to deal with the source code manipulation and which stores information remotely and shares these information with others colleagues. Currently, SCAF is a pre-alpha and will be released in few days.
2 - SCAF architecture
SCAF is written in Python and offers two modules, an API and a GUI. The API is used to parse source code, to save parsing information in a database and do some analyzes. The GUI is mainly used to browse source code and to display API information but we can plug any others GUI (like a web app based on Apache/mod_python).
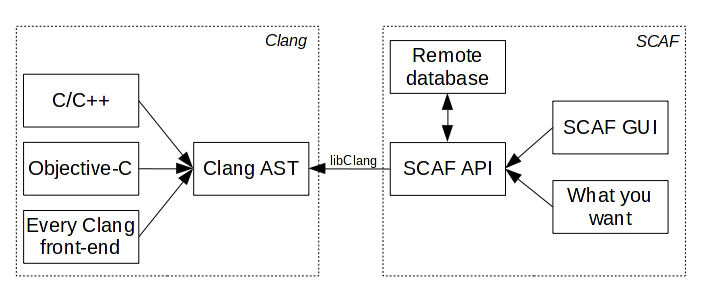
The API uses the libClang [1] to parse the source code and saves the AST in the database. When the AST (or part of it) is already stored, you don't have to re-parse the source code. All information can be directly requested via the API, which will extract data and metadata from the database, providing helpers to use them.
3 - Hook the "make" process
In source code analysis, one of the main issues is dealing with the context of compilation: include directories, preprocessor tricks and other obscure voodoo things that can be part of a build chain. When you have to parse a file, you must set up a context as close as possible the one used during compilation, otherwise you will get a lot of parsing issues. For that, you have two options:
The hard one: Parse the "Makefile"
The lazy one: Hook the make process
Actually, the best way (I guess) is to hook the make process (Yes, you're right, French guys are lazy, it's well known). Via this hook, you can get all information in a compilation context and forward everything to your parsing process.
SCAF offers an "agent" which hooks the make process and forwards all flags to both a compiler and the SCAF API. You just have to overload the CC variable like that:
$ make CC=/usr/bin/scaf_agent SCAF_HOST=localhost SCAF_LOGIN=user SCAF_PASSW=pwd SCAF_DB=project_1
In this case, the SCAF agent will saves all information in the "project_1" database and you don't care about flags and others compiler stuff. Then, after the compilation is completed, you can get any source code related information directly from the database.
4 - API under the hood
4.1 - API classes
There are still lot of classes in progress or things to do like aliasing, taint, symbolic... But currently these following classes are reliable:
SCAFDatabase: Database communication.
SCAFParsing: Parsing via the libClang.
SCAFAst: AST reconstruction.
SCAFAnalysis: This class contains all analysis.
SCAFCallsTraceAnalysis: Calls trace and xrefs.
4.2 - Parse a file and save information
The following example will create a new database, parse a file (with a default compilation context) and save information.
>>> from SCAF.API.Analysis import *
>>>
>>> analysis = SCAFAnalysis('localhost', 'login', 'pwd')
>>> analysis.createNewDatabase('SCAF_test1')
>>> analysis.useDatabase('SCAF_test1')
>>> analysis.parseFile('/tmp/test.c')
>>> analysis.closeDatabase()
Then, when you want to get information back, you just have to use the "SCAF_test1" database.
>>> from SCAF.API.Analysis import *
>>>
>>> analysis = SCAFAnalysis('localhost', 'login', 'pwd')
>>> analysis.getDatabaseListing()
['SCAF_driver', 'SCAF_driver2', 'SCAF_driver_w83793', 'SCAF_test1', 'SCAF_vmndh']

>>> analysis.useDatabase('SCAF_test1')

>>> analysis.getNumberOfNodesSaved()
16L

>>> analysis.getFilesList()
['/tmp/test.c']

>>> print analysis.getFileContent('/tmp/test.c')
int main(int ac, const char **av)
{
  int a = 1;
  int b = 2;

  return a + b;
}
>>>
When you parse files, these files will be stocked in the database allowing colleagues to work on the same project without any source on their disk.
4.3 - Run through the AST
The AST reconstruction is fully transparent, at each request in the API, a node is returned and can be run through like the original AST.
Each node returned by the getNodes() methods is a SCAF.API.AST.SCAFAst which contains these following attributes and methods:
self.idNode
self.idNodeParent
self.spelling
self.kind
self.type
self.value
self.result
self.fileName
self.startLine
self.endLine
self.startColumn
self.endColumn
self.getParent()
self.getChildren()
self.getContent()
The getParent() and getChildren() methods return also a SCAF.API.AST.SCAFAst which can be used to run through the AST recursively.
>>> nodes = analysis.getNodes(spelling='main')
>>> nodes
[<SCAF.API.AST.SCAFAst instance at 0x7fb94bda9170>]

>>> main = nodes[0]
>>> main
<SCAF.API.AST.SCAFAst instance at 0x7fb94bda9170>

>>> main.fileName
'/tmp/test.c'

>>> main.startLine
1L

>>> main.endLine
7L

>>> main.spelling
'main'

>>> main.kind
'FUNCTION_DECL'

>>> main.type
'FunctionProto'
Get children from a node:
>>> main
<SCAF.API.AST.SCAFAst instance at 0x7fb94bda9170>
>>> children = main.getChildren()
>>> children
[<SCAF.API.AST.SCAFAst instance at 0x7fb94bda9200>, <SCAF.API.AST.SCAFAst instance at 0x7fb94bda9248>, <SCAF.API.AST.SCAFAst instance at 0x7fb94bda9290>]
>>> for child in children:
... print child.kind, child.spelling
...
PARM_DECL ac
PARM_DECL av
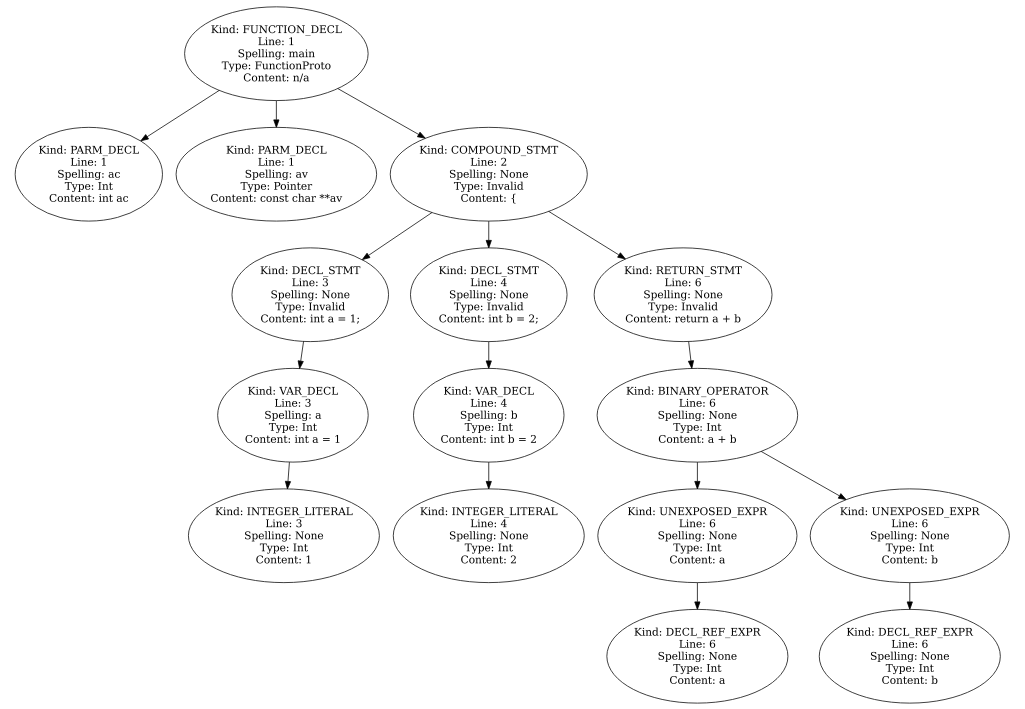
COMPOUND_STMT None
The COMPOUND_STMT is the statement node of the main function. Below, the complete AST of the main function.
The getNodes() method can take all SCAst attributes as filters in its arguments.
getNodes(kind='...', startLine='...', fileName='...', spelling='...', ...)
Each node has a kind (FUNCTION_DECL, COMPOUND_STMT, etc) and the possible list of kind is:
['ADDR_LABEL_EXPR', 'ANNOTATE_ATTR', 'ARRAY_SUBSCRIPT_EXPR', 'ASM_LABEL_ATTR', 'ASM_STMT', 'BINARY_OPERATOR',
'BLOCK_EXPR', 'BREAK_STMT', 'CALL_EXPR', 'CASE_STMT', 'CHARACTER_LITERAL', 'CLASS_DECL', 'CLASS_TEMPLATE',
'CLASS_TEMPLATE_PARTIAL_SPECIALIZATION', 'COMPOUND_ASSIGNMENT_OPERATOR', 'COMPOUND_LITERAL_EXPR', 'COMPOUND_STMT',
'CONDITIONAL_OPERATOR', 'CONSTRUCTOR', 'CONTINUE_STMT', 'CONVERSION_FUNCTION', 'CSTYLE_CAST_EXPR',
'CXX_ACCESS_SPEC_DECL', 'CXX_BASE_SPECIFIER', 'CXX_BOOL_LITERAL_EXPR', 'CXX_CATCH_STMT', 'CXX_CONST_CAST_EXPR',
'CXX_DELETE_EXPR', 'CXX_DYNAMIC_CAST_EXPR', 'CXX_FINAL_ATTR', 'CXX_FOR_RANGE_STMT', 'CXX_FUNCTIONAL_CAST_EXPR',
'CXX_METHOD', 'CXX_NEW_EXPR', 'CXX_NULL_PTR_LITERAL_EXPR', 'CXX_OVERRIDE_ATTR', 'CXX_REINTERPRET_CAST_EXPR',
'CXX_STATIC_CAST_EXPR', 'CXX_THIS_EXPR', 'CXX_THROW_EXPR', 'CXX_TRY_STMT', 'CXX_TYPEID_EXPR', 'CXX_UNARY_EXPR',
'DECL_REF_EXPR', 'DECL_STMT', 'DEFAULT_STMT', 'DESTRUCTOR', 'DO_STMT', 'ENUM_CONSTANT_DECL', 'ENUM_DECL',
'FIELD_DECL', 'FLOATING_LITERAL', 'FOR_STMT', 'FUNCTION_DECL', 'FUNCTION_TEMPLATE', 'GENERIC_SELECTION_EXPR',
'GNU_NULL_EXPR', 'GOTO_STMT', 'IB_ACTION_ATTR', 'IB_OUTLET_ATTR', 'IB_OUTLET_COLLECTION_ATTR', 'IF_STMT',
'IMAGINARY_LITERAL', 'INCLUSION_DIRECTIVE', 'INDIRECT_GOTO_STMT', 'INIT_LIST_EXPR', 'INTEGER_LITERAL',
'INVALID_CODE', 'INVALID_FILE', 'LABEL_REF', 'LABEL_STMT', 'LINKAGE_SPEC', 'MACRO_DEFINITION', 'MACRO_INSTANTIATION',
'MEMBER_REF', 'MEMBER_REF_EXPR', 'NAMESPACE', 'NAMESPACE_ALIAS', 'NAMESPACE_REF', 'NOT_IMPLEMENTED',
'NO_DECL_FOUND', 'NULL_STMT', 'OBJC_AT_CATCH_STMT', 'OBJC_AT_FINALLY_STMT', 'OBJC_AT_SYNCHRONIZED_STMT',
'OBJC_AT_THROW_STMT', 'OBJC_AT_TRY_STMT', 'OBJC_AUTORELEASE_POOL_STMT', 'OBJC_BRIDGE_CAST_EXPR', 'OBJC_CATEGORY_DECL',
'OBJC_CATEGORY_IMPL_DECL', 'OBJC_CLASS_METHOD_DECL', 'OBJC_CLASS_REF', 'OBJC_DYNAMIC_DECL', 'OBJC_ENCODE_EXPR',
'OBJC_FOR_COLLECTION_STMT', 'OBJC_IMPLEMENTATION_DECL', 'OBJC_INSTANCE_METHOD_DECL', 'OBJC_INTERFACE_DECL',
'OBJC_IVAR_DECL', 'OBJC_MESSAGE_EXPR', 'OBJC_PROPERTY_DECL', 'OBJC_PROTOCOL_DECL', 'OBJC_PROTOCOL_EXPR',
'OBJC_PROTOCOL_REF', 'OBJC_SELECTOR_EXPR', 'OBJC_STRING_LITERAL', 'OBJC_SUPER_CLASS_REF', 'OBJC_SYNTHESIZE_DECL',
'OVERLOADED_DECL_REF', 'PACK_EXPANSION_EXPR', 'PAREN_EXPR', 'PARM_DECL', 'PREPROCESSING_DIRECTIVE', 'RETURN_STMT',
'SEH_EXCEPT_STMT', 'SEH_FINALLY_STMT', 'SEH_TRY_STMT', 'SIZE_OF_PACK_EXPR', 'STRING_LITERAL', 'STRUCT_DECL',
'SWITCH_STMT', 'StmtExpr', 'TEMPLATE_NON_TYPE_PARAMETER', 'TEMPLATE_REF', 'TEMPLATE_TEMPLATE_PARAMETER',
'TEMPLATE_TYPE_PARAMETER', 'TRANSLATION_UNIT', 'TYPEDEF_DECL', 'TYPE_ALIAS_DECL', 'TYPE_REF', 'UNARY_OPERATOR',
'UNEXPOSED_ATTR', 'UNEXPOSED_DECL', 'UNEXPOSED_EXPR', 'UNEXPOSED_STMT', 'UNION_DECL', 'USING_DECLARATION',
'USING_DIRECTIVE', 'VAR_DECL', 'WHILE_STMT']
So, for example, if you want all functions, you just have to do something like that:
>>> analysis = SCAFAnalysis('localhost', 'login', 'pwd')
>>> analysis.useDatabase('SCAF_vmndh')
>>> funcs = analysis.getNodes(kind='FUNCTION_DECL')
>>> len(funcs)
275
>>>
Or, if you are looking for attributes of a specific structure:
>>> analysis = SCAFAnalysis('localhost', 'login', 'pwd')
>>> analysis.useDatabase('SCAF_driver_w83793')
>>> len(analysis.getNodes(kind='STRUCT_DECL'))
948

>>> analysis.getNodes(kind='STRUCT_DECL', spelling='watchdog_info')
[<SCAF.API.AST.SCAFAst instance at 0x7fb9487dad40>]

>>> watchdog_info = analysis.getNodes(kind='STRUCT_DECL', spelling='watchdog_info')[0]
>>> watchdog_info.fileName
'/usr/src/linux-3.14.14-gentoo/include/uapi/linux/watchdog.h'

>>> watchdog_info.startLine
17L

>>> watchdog_info.endLine
21L

>>> attributes = watchdog_info.getChildren()
>>> len(attributes)
3

>>> for attr in attributes:
...     print attr.kind, attr.spelling, attr.getContent()
...
FIELD_DECL options __u32 options
FIELD_DECL firmware_version __u32 firmware_version
FIELD_DECL identity __u8  identity[32]
>>>
If we do some speed benchmark about the search engine on a big source project like a Linux driver with all kernel includes.
#!/usr/bin/env python2
## -*- coding: utf-8 -*-

from SCAF.API.Analysis import *

analysis = SCAFAnalysis('localhost', 'login', 'pwd')
analysis.useDatabase('SCAF_driver_w83793')
print 'Looking into %d files' %(len(analysis.getFilesList()))
for node in analysis.getNodes(spelling='i'):
    print node.kind, node.fileName, node.startLine, node.startColumn, node.getContent()
We have something like that - Tested on a Lenovo x230:
$ time python2 ./test.py
Looking into 274 files
PARM_DECL /usr/src/linux-3.14.14-gentoo/include/linux/bitmap.h 115 44 int i
PARM_DECL /usr/src/linux-3.14.14-gentoo/arch/x86/include/asm/atomic.h 36 44 int i
PARM_DECL /usr/src/linux-3.14.14-gentoo/arch/x86/include/asm/atomic.h 48 31 int i
PARM_DECL /usr/src/linux-3.14.14-gentoo/arch/x86/include/asm/atomic.h 62 31 int i
PARM_DECL /usr/src/linux-3.14.14-gentoo/arch/x86/include/asm/atomic.h 78 39 int i
PARM_DECL /usr/src/linux-3.14.14-gentoo/arch/x86/include/asm/atomic.h 142 39 int i
PARM_DECL /usr/src/linux-3.14.14-gentoo/arch/x86/include/asm/atomic.h 154 37 int i
PARM_DECL /usr/src/linux-3.14.14-gentoo/arch/x86/include/asm/atomic.h 166 37 int i
PARM_DECL /usr/src/linux-3.14.14-gentoo/arch/x86/include/asm/atomic64_64.h 31 48 long i
PARM_DECL /usr/src/linux-3.14.14-gentoo/arch/x86/include/asm/atomic64_64.h 43 33 long i
PARM_DECL /usr/src/linux-3.14.14-gentoo/arch/x86/include/asm/atomic64_64.h 57 33 long i
PARM_DECL /usr/src/linux-3.14.14-gentoo/arch/x86/include/asm/atomic64_64.h 73 41 long i
PARM_DECL /usr/src/linux-3.14.14-gentoo/arch/x86/include/asm/atomic64_64.h 139 41 long i
PARM_DECL /usr/src/linux-3.14.14-gentoo/arch/x86/include/asm/atomic64_64.h 151 40 long i
PARM_DECL /usr/src/linux-3.14.14-gentoo/arch/x86/include/asm/atomic64_64.h 156 40 long i
PARM_DECL /usr/src/linux-3.14.14-gentoo/include/linux/atomic.h 115 30 int i
PARM_DECL /usr/src/linux-3.14.14-gentoo/include/asm-generic/atomic-long.h 34 54 long i
PARM_DECL /usr/src/linux-3.14.14-gentoo/include/asm-generic/atomic-long.h 55 36 long i
PARM_DECL /usr/src/linux-3.14.14-gentoo/include/asm-generic/atomic-long.h 62 36 long i
PARM_DECL /usr/src/linux-3.14.14-gentoo/include/asm-generic/atomic-long.h 69 44 long i
PARM_DECL /usr/src/linux-3.14.14-gentoo/include/asm-generic/atomic-long.h 90 44 long i
PARM_DECL /usr/src/linux-3.14.14-gentoo/include/asm-generic/atomic-long.h 97 43 long i
PARM_DECL /usr/src/linux-3.14.14-gentoo/include/asm-generic/atomic-long.h 104 43 long i
PARM_DECL /usr/src/linux-3.14.14-gentoo/arch/x86/include/asm/pvclock.h 103 34 struct pvclock_vsyscall_time_info *i
VAR_DECL /usr/src/linux-3.14.14-gentoo/include/linux/slab.h 486 3 int i = kmalloc_index(size)
PARM_DECL /usr/src/linux-3.14.14-gentoo/include/linux/klist.h 62 46 struct klist_iter *i
PARM_DECL /usr/src/linux-3.14.14-gentoo/include/linux/klist.h 63 51 struct klist_iter *i
PARM_DECL /usr/src/linux-3.14.14-gentoo/include/linux/klist.h 65 29 struct klist_iter *i
PARM_DECL /usr/src/linux-3.14.14-gentoo/include/linux/klist.h 66 38 struct klist_iter *i
VAR_DECL /usr/src/linux-3.14.14-gentoo/include/linux/dqblk_qtree.h 49 2 int i
PARM_DECL /usr/src/linux-3.14.14-gentoo/include/linux/fs.h 304 3 struct iov_iter *i
PARM_DECL /usr/src/linux-3.14.14-gentoo/include/linux/fs.h 306 3 struct iov_iter *i
PARM_DECL /usr/src/linux-3.14.14-gentoo/include/linux/fs.h 307 23 struct iov_iter *i
PARM_DECL /usr/src/linux-3.14.14-gentoo/include/linux/fs.h 308 32 struct iov_iter *i
PARM_DECL /usr/src/linux-3.14.14-gentoo/include/linux/fs.h 309 34 const struct iov_iter *i
PARM_DECL /usr/src/linux-3.14.14-gentoo/include/linux/fs.h 311 34 struct iov_iter *i
PARM_DECL /usr/src/linux-3.14.14-gentoo/include/linux/fs.h 323 37 struct iov_iter *i
VAR_DECL /secure/QuarksLab/Research/SCAF/samples/driver/w83793/w83793.c 867 3 int i = index >> 1
VAR_DECL /secure/QuarksLab/Research/SCAF/samples/driver/w83793/w83793.c 1375 4 size_t i
VAR_DECL /secure/QuarksLab/Research/SCAF/samples/driver/w83793/w83793.c 1513 2 int i
VAR_DECL /secure/QuarksLab/Research/SCAF/samples/driver/w83793/w83793.c 1580 2 int i
python2 ./test.py  0.09s user 0.01s system 70% cpu 0.145 total
$
As you can see it's pretty fast and we got all nodes which are named "i" - It's different of a simple grep search which will give us all occurrences of "i". This is the first advantage of centralized information. The second advantage is that you don't need the project sources on your disk and you can share everything remotely without that your colleagues have to re-parse a second time the source code.
5 - Calls trace and xrefs
The calls trace is also available as a tree. Each node is a SCAFCallsTraceAnalysisAst and this class contains only one attribute and two methods:
self.spelling : function name
self.getNode() : FUNCTION_DECL AST node
self.getChildren() : Called functions
So, you can run through the calls trace recursively via the getChildren() method and jump in the function's AST via the getNode() method.
5.1 - How to get a SCAFCallsTraceAnalysisAst from a SCAFAst node
The getAstFromNode() from the SCAFCallsTraceAnalysis class allows to make a SCAFCallsTraceAnalysisAst from a SCAFAst.
>>> from SCAF.API.Analysis import *
>>>
>>> analysis = SCAFAnalysis('localhost', 'login', 'pwd')
>>> analysis.useDatabase('SCAF_vmndh')

>>> main = analysis.getNodes(spelling='main')[0]
>>> main
<SCAF.API.AST.SCAFAst instance at 0x7f72a2b45560>

>>> ctNode = analysis.callsTraceAnalysis.getAstFromNode(main)
>>> ctNode
<SCAF.API.CallsTraceAnalysis.SCAFCallsTraceAnalysisAst instance at 0x7f72a2b45638>
5.2 - Display the called functions
As I already said above, you can run through the calls trace recursively via the getChildren() method and display the function name.
>>> ctNode = analysis.callsTraceAnalysis.getAstFromNode(main)
>>> ctNode
<SCAF.API.CallsTraceAnalysis.SCAFCallsTraceAnalysisAst instance at 0x7f72a2b45638>

>>> for child in ctNode.getChildren():
...     print child
...
check_aslr_mode
check_nx_mode
check_pie_mode
check_debug_mode
check_core_mode
check_file_mode
syntax
Each child is also a SCAFCallsTraceAnalysisAst class. Below, a little code which run through the calls trace recursively:
$ cat a.py
#!/usr/bin/env python2
## -*- coding: utf-8 -*-
from SCAF.API.Analysis import *
def throughAST(ctNode, depth):
print ("...." * depth), ctNode
for child in ctNode.getChildren():
throughAST(child, depth + 1)
if __name__ == '__main__':
analysis = SCAFAnalysis('localhost', 'login', 'pwd')
analysis.useDatabase('SCAF_vmndh')
func = analysis.getNodes(spelling='init_vmem')[1]
ctNode = analysis.callsTraceAnalysis.getAstFromNode(func)
throughAST(ctNode, 0)
$ python2 a.py
init_vmem
.... xmalloc
........ malloc
........ perror
........ exit
.... memset
.... rand_aslr
.... rand_pie
.... set_arg_in_memory
........ strlen
........ fprintf
........ exit
........ strcpy
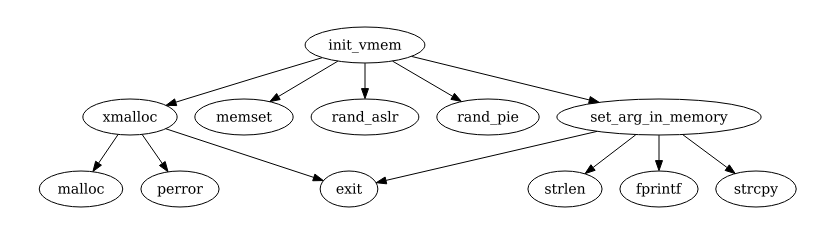
$
The visualization of this calls trace with Dot, is:
5.3 - Check if two functions are linked
The isLinked() method allows to know if two functions are linked. Example:
>>> init_vmem = analysis.getNodes(spelling='init_vmem')[1]
>>> xmalloc = analysis.getNodes(spelling='xmalloc')[1]
>>> set_arg = analysis.getNodes(spelling='set_arg_in_memory')[0]

>>> analysis.callsTraceAnalysis.isLinked(init_vmem, set_arg)
True

>>> analysis.callsTraceAnalysis.isLinked(xmalloc, set_arg)
False
5.4 - Know the depth between two functions
In order to make some specific analyzis, we sometimes have to know the depth between two functions. The getDepths() method can give us this information:
>>> analysis.callsTraceAnalysis.getDepths(init_vmem, set_arg)
[1]

>>> analysis.callsTraceAnalysis.getDepths(init_vmem, 'exit')
[2, 2]

>>> analysis.callsTraceAnalysis.getDepths(main, 'exit')
[3, 4, 4, 4, 4, 4, 4, 4, 5, 4, 2, 2]
>>>
In the first case, we have only one possible path with a 1 depth. In the second case, we have two possibles paths with both a depth of 2. In the last case, we have 12 possibles paths with a least depth of 2.
5.5 - Get all calls trace between two functions
Like the getDepths(), we can get the trace with the getTraces() method.
>>> analysis.callsTraceAnalysis.getTraces(init_vmem, 'exit')
[
  [<SCAFCallsTraceAnalysisAst>, <SCAFCallsTraceAnalysisAst>, <SCAFCallsTraceAnalysisAst>],
  [<SCAFCallsTraceAnalysisAst>, <SCAFCallsTraceAnalysisAst>, <SCAFCallsTraceAnalysisAst>]
]

>>> len(analysis.callsTraceAnalysis.getTraces(init_vmem, 'exit'))
2

>>> for x in analysis.callsTraceAnalysis.getTraces(init_vmem, 'exit'):
...     for c in x:
...             sys.stdout.write(' -> ' + c.spelling)
...     sys.stdout.write('\n')
...
 -> init_vmem -> xmalloc -> exit
 -> init_vmem -> set_arg_in_memory -> exit
>>>
Another example with all calls trace between main and exit:
>>> for x in analysis.callsTraceAnalysis.getTraces(main, 'exit'):
...     for c in x:
...             sys.stdout.write(' -> ' + c.spelling)
...     sys.stdout.write('\n')
...
 -> main -> check_file_mode -> check_arg_mode -> exit
 -> main -> check_file_mode -> init_vmem -> xmalloc -> exit
 -> main -> check_file_mode -> init_vmem -> set_arg_in_memory -> exit
 -> main -> check_file_mode -> save_binary -> xopen -> exit
 -> main -> check_file_mode -> save_binary -> xmalloc -> exit
 -> main -> check_file_mode -> save_binary -> xread -> exit
 -> main -> check_file_mode -> parse_binary -> error_ndh_format -> exit
 -> main -> check_file_mode -> parse_binary -> xmalloc -> exit
 -> main -> check_file_mode -> execute -> check_pc -> segfault -> exit
 -> main -> check_file_mode -> execute -> segfault -> exit
 -> main -> check_file_mode -> exit
 -> main -> syntax -> exit
>>>
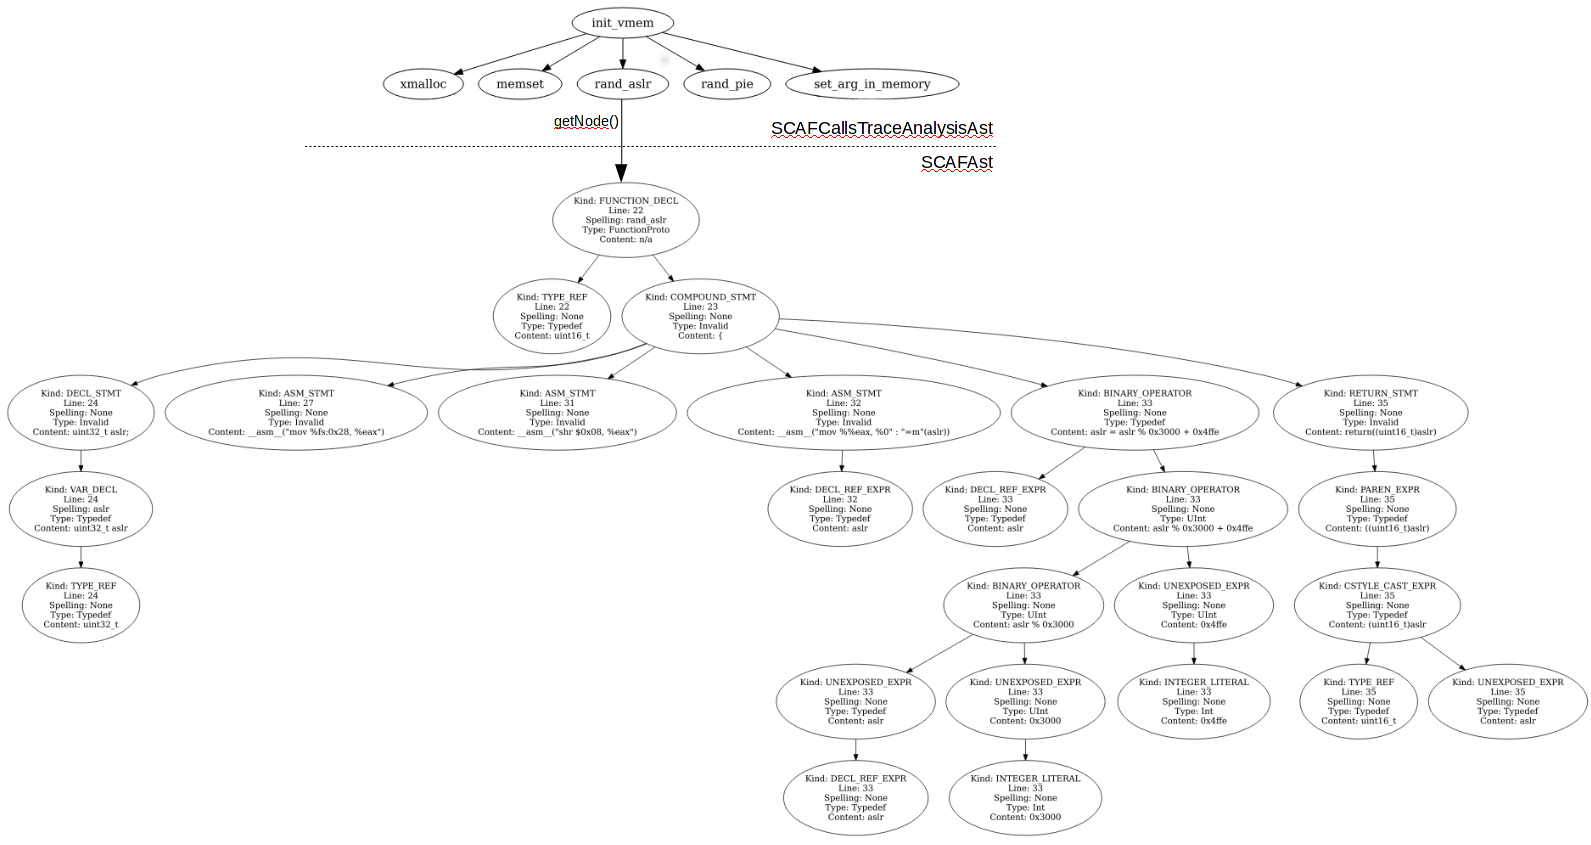
5.6 - Jump from SCAFCallsTraceAnalysisAst to SCAFAst
We can also jump from a SCAFCallsTraceAnalysisAst to a SCAFAst for analyze a specific function in your calls trace. For that, you have to use the getNode() method which returns a SCAFAst node:
5.7 - Xrefs
The getXRefs() returns a list of the caller functions.
>>> xrefs = analysis.callsTraceAnalysis.getXRefs('exit')
>>> len(xrefs)
12

>>> for x in xrefs:
...     print x.spelling
...
set_arg_in_memory
syntax
segfault
error_ndh_format
xmalloc
xopen
xmmap
xread
console_quit
check_arg_mode
syscall_exit
check_file_mode
>>>
6 - GUI Screenshots
Some screenshots of the pre-alpha GUI are available here [2].
7 - Conclusion
The main objectives of SCAF are :
Allow you to work on projects which contains a lot of sources code.
Offers an other abstraction which allows you to use and search some specific nodes really easily.
Allow you to work on an analysis with others colleagues and share notes, favorites, information and analysis results.
This project is developed in python as two distinct module (API and GUI) and the API can be plugged/used on any others projects.
SCAF is still in pre-alpha and will be released in few days. Before the release, I have to make more helpers/examples scripts and write some documentations - All the boring parts :( but the helpful parts if you plan to use/contribute to this project.
8 - Acknowledgments
Thanks to:
Kévin Szkudlapski, Serge Guelton, Adrien Guinet and Cédric Tessier for some source code analysis tricks and conception.
Fabian 'fabs' Yamaguchi for some ideas related to his work [3].