This article introduces a kind of eBPF program that may be used to monitor userspace programs. It first introduces you to eBPF and uprobes and then explores the flaws that we found in uprobes.
This blog post presents a topic that I tackled during my internship on eBPF for security. All the examples work with Linux and x86_64 architecture.
Introduction
Monitoring what happens on your system is really important. eBPF can help you to do so on your Linux server by hooking specific programs to various system-wide events. You can gather a lot of information by hooking into kernel or userspace functions. For example, you can read the content of encrypted communication between two processes or find which process uses a specific function of a library. A good way to understand eBPF is to keep this diagram in mind:
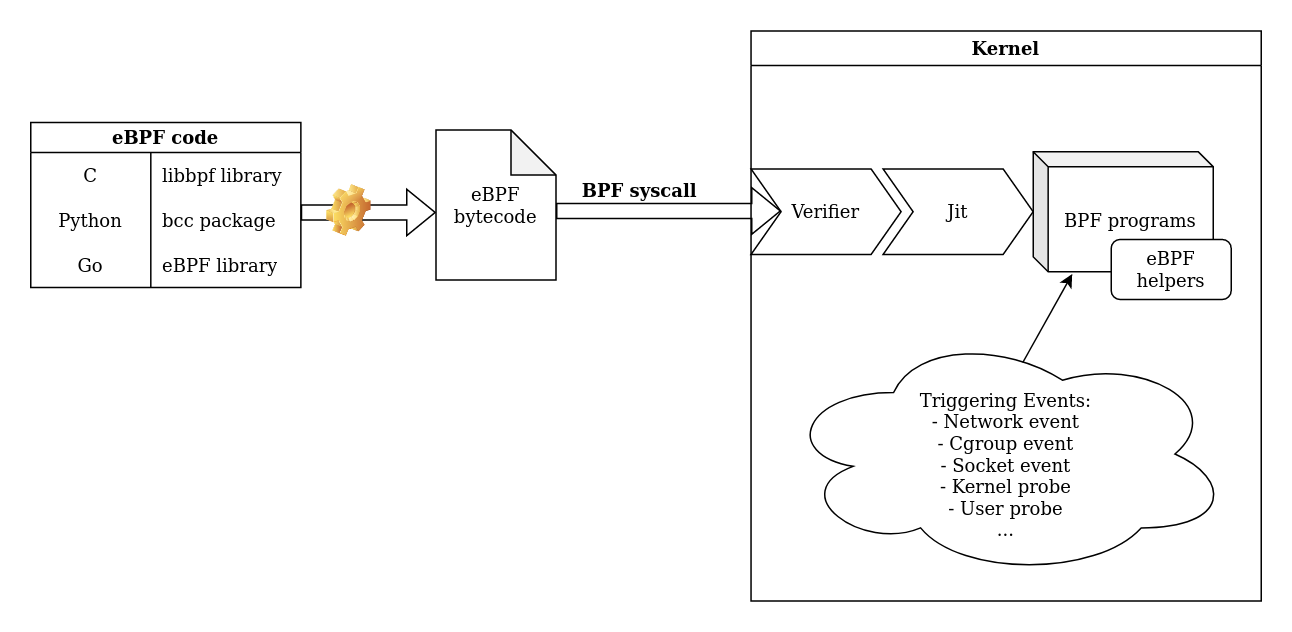
To create your own eBPF program, choose one of the eBPF libraries, it will generate an eBPF bytecode and then call the bpf syscall to load it in the kernel. On the kernel side, your program will be verified and loaded if it is safe. You must also keep in mind that there are different types of eBPF programs (adapted to the triggering event) and each one has access to different eBPF helpers and contexts. The current tools using eBPF for monitoring often involve kprobes (kernel probes). As an example, this kind of program allows you to record each time a process uses a syscall. However, not all interesting information can be captured this way. This is why new research is being conducted on uprobes (userland probes) to monitor in userland.
Uprobes: the basics
Definition
Uprobes are a kernel feature that allows hooking into any instruction of any userspace program. When these hooks are triggered, an event is created and the context of the probed program is provided to the handlers (for example, an eBPF program). You can then log the CPU registers' values or execute an eBPF program. For example, the peetch collection of tools, developed by Quarkslab, uses eBPF with uprobes hooks on SSL_read() and SSL_write() OpenSSL functions to log the TLS messages system-wide and access data in plaintext.
How to create one
You can create a uprobe with the /sys pseudo-filesystem by adding a line to the /sys/kernel/debug/tracing/uprobe_events file. The syntax is the following:
p[:[GRP/]EVENT] PATH:OFFSET [FETCHARGS] : Set a uprobe
r[:[GRP/]EVENT] PATH:OFFSET [FETCHARGS] : Set a return uprobe (uretprobe)
-:[GRP/]EVENT                           : Clear uprobe or uretprobe event
For more details, see the kernel documentation.
Example
The best way to learn is to practice. Let’s create a uprobe that prints every command issued on the system.
First, we need to find a place to hook. We have chosen readline() from the bash binary. That's a good choice because our command is returned at the end of the function. Now, let’s find the offset of readline into /bin/bash. A quick way to achieve this is to use gdb:
gdb /bin/bash
(gdb) p readline
$1 = {<text variable, no debug info>} 0xd5690 <readline>
As given by gdb above, our offset is 0xd5690. The kernel documentation explains that we can print the return value in a uretprobe. Uretprobes are just uprobes placed at the end of the function. Our command must begin with r: for "uretprobe" followed by the name of our probe bashReadline, the path of the binary /bin/bash, the offset 0xd5690 and the return value printed as a string: cmd=+0($retval):string.
# First log-in as root.

# This line creates a uretprobe named bashReadline at offset 0xd5690 of /bin/bash program that prints the return value as a string.
echo 'r:bashReadline /bin/bash:0xd5690 cmd=+0($retval):string' >> /sys/kernel/tracing/uprobe_events

# When the uprobe is added, activate it with this command:
echo 1 > /sys/kernel/tracing/events/uprobes/bashReadline/enable

cat /sys/kernel/tracing/trace_pipe
    bash-24834   [010] ..... 26372.295012: bashReadline: (0x5630d6af8015 <- 0x5630d6b98690) cmd="cat trace_pipe "
   <...>-14869   [014] ..... 26393.048772: bashReadline: (0x55f2c8640015 <- 0x55f2c86e0690) cmd="ls"
    bash-14869   [014] ..... 26399.267734: bashReadline: (0x55f2c8640015 <- 0x55f2c86e0690) cmd="whoami"
   <...>-24909   [010] ..... 26428.810573: bashReadline: (0x5638c7785015 <- 0x5638c7825690) cmd="cat /etc/passwd"
Warning
If you receive the error Device or resource busy while writing to the uprobe_events file, set /sys/kernel/tracing/events/uprobes/enabled to 0 and try again.
If you receive Invalid argument, read the /sys/kernel/tracing/error_log file for details.
Your kernel must have CONFIG_UPROBES enabled (on by default if your Linux kernel is version 3.5 or higher).
Level-up with eBPF
If you want to do more than printing, and add some logic to your uprobe, you can use an eBPF program. To simplify, we will use the bcc python package that does the hard work for us. You just have to create a bpf object with the constructor, and hook it to the uretprobe with the attach_uretprobe() method. Finally, we write a little eBPF program that reads the command and the current user id, and prints it if the user is root.
#!/usr/bin/python3

from bcc import BPF
from time import sleep


# load BPF program
bpf_text="""
#include <linux/sched.h>

int printForRoot(struct pt_regs *ctx){

    char command[16] = {};

    //use a bpf helper to get the user id.
    uid_t uid = bpf_get_current_uid_gid() & 0xffffffff;

    //another bpf helper to read a string in userland
    bpf_probe_read_user_str(&command, sizeof(command), (void *)PT_REGS_RC(ctx));

    if(uid == 0){
        bpf_trace_printk("Command from root: %s",command);
    }
    return 0;
}
"""


b = BPF(text=bpf_text)
b.attach_uretprobe(name="/bin/bash", sym="readline", fn_name="printForRoot")

while(1):
    sleep(1)
cat /sys/kernel/tracing/trace_pipe
    bash-9442    [000] d...1  2634.932058: bpf_trace_printk: Command from root: whoami
    bash-9442    [000] d...1  3575.645538: bpf_trace_printk: Command from root: cd /root/
    bash-9442    [000] d...1  3584.413448: bpf_trace_printk: Command from root: sl
Now that you know how to use uprobes, the next section will show you the kernel side.
How uprobes work under the hood
Uprobe creation
The kernel implements uprobes as special breakpoints that are used only by the kernel. Uprobes are made of the program file inode, the instruction offset, the list of related actions and the replaced instruction code. When you create a probe, it is added to a specific binary tree.
When setting up a uprobe, the kernel calls probes_write() and trace_uprobe_create() which calls __trace_uprobe_create(). This last function takes as arguments our line from uprobe_events and calls kern_path() which gets the inode of the file corresponding to our path.
Then later register_trace_uprobe(), _add_event_to_tracers() and other functions create the pseudo-directory /sys/kernel/tracing/events/uprobes/<EVENT>/ and some files (enable, id, …).
probes_write(){
   trace_uprobe_create(){
      /*
       * Argument syntax:
       *  - Add uprobe: p|r[:[GRP/]EVENT] PATH:OFFSET[%return][(REF)] [FETCHARGS]
       */
      __trace_uprobe_create(int argc, const char **argv);
   }
}
Uprobe activation
When we enable the uprobe, the following nested calls are made: trace_uprobe_register() => probe_event_enable() => trace_uprobe_enable() => uprobe_register().
This last function calls two other interesting ones:
alloc_uprobe() that creates a struct uprobe with the inode, offset and replaced instruction; and calls insert_uprobe() that adds this uprobe to the uprobe rb_tree.
register_for_each_vma() that loops on all existing virtual memory areas and find the ones that correspond to some uprobe's inode (and verify valid_vma()). On these vma it calls install_breakpoint() that copies the full probed instruction in arch.insn - a struct that depends on the current architecture - and then replaces it with a breakpoint.
trace_uprobe_register(){
   probe_event_enable(){
      trace_uprobe_enable(){
         uprobe_register(){
            alloc_uprobe(){
               struct uprobe{
                  inode;
                  offset;
                  insn;
               }
               insert_uprobe();
            }
            register_for_each_vma(){
               if(valid_vma){
                  install_breakpoint();
               }
            }
         }
      }
   }
}
Detection of new program instances
When an ELF program is executed, its memory is mapped using the mmap syscall. The function mmap_region/vma_merge => __vma_adjust() is called in the kernel to manage this mapping. __vma_adjust() is a helper function used when Virtual Memory Areas are added/modified. It calls uprobe_mmap() for file-backed vma. The code section of our program is linked to its program file so uprobe_mmap() is called for the vma containing our uprobe.
If valid_vma() is ok, it uses build_probe_list() to find all the uprobes matching this inode in the uprobe rb_tree and calls install_breakpoint() for each one.
SYS_mmap(){
   mmap_region/vma_merge(){
      __vma_adjust(){
         uprobe_mmap(){
            if(valid_vma){
               build_probe_list(){
                  for each uprobe:
                     install_breakpoint();
               }
            }
         }
      }
   }
}
Remember that uprobes are added to new program instances during the mmap call!
Uprobe event
When the breakpoint is reached, an int3 exception is triggered. do_int3() calls notify_die(DIE_INT3, …), then atomic_notifier_call_chain(&die_chain, …) is called. The chain die_chain contains all notifiers previously registered via register_die_notifier(). atomic_notifier_call_chain calls notifier_call_chain() which informs the notifiers registered in the chain about an event via their notifier_call attribute. For our uprobe it’s arch_uprobe_exception_notify() that was set at uprobe_init(). It calls uprobe_pre_sstep_notifier() which set TIF_UPROBE flag. While returning to userspace, the thread notices the TIF_UPROBE flag and calls uprobe_notify_resume(struct pt_regs * regs) which calls handle_swbp(regs).
This function does two main things:
handler_chain(find_active_uprobe()) which executes the handlers of this uprobe. For example, a perf_event used by an eBPF program.
pre_ssout() which prepares to single-step the probed instruction. This instruction can’t be executed in program memory because the original instruction has been replaced by the uprobe breakpoint opcode. Kernel developers first tried to remove the breakpoint temporarily but there were some issues, so they chose to execute this instruction out of line (also called xol) in a new memory area. So, it first calls xol_get_insn_slot to get the xol virtual address, and this function uses get_xol_area() that will setup the [uprobes] special virtual memory area if it is not yet created with xol_add_vma() => install_special_mapping(). This vma is the place where the original instruction will be executed out of line. To continue with pre_ssout(), it uses arch_uprobe_pre_xol() that calls regs_set_return_ip(regs, current->utask->xol_vaddr) and user_enable_single_step(). At this point current->utask->xol_vaddr points to the allocated XOL slot previously created. So this function sets the program counter to the place where the copy of the original instruction is and activates the single step mode. Then, this instruction will be executed and the program will be stopped again.
arch_uprobe_post_xol is called from uprobe_notify_resume when the single-step is over. This function prepares to resume execution after the single-step and calls the post_xol handler. By default it is default_post_xol_op (see also branch_post_xol_op). The new RIP register is relative to the copied instruction, so it makes it relative to the original instruction (with some exceptions like return, call, absolute or indirect jump). If the instruction used RIP then it is replaced by another register. The value of this register is restored and finally the program execution is resumed.
[...]
uprobe_init(){
   register_die_notifier(arch_uprobe_exception_notify);
}
[...]//breakpoint is reached
do_int3(){
   notify_die(DIE_INT3, ...){
      atomic_notifier_call_chain(&die_chain, ...){
         notifier_call_chain(){
            for each:
               notifier_call = arch_uprobe_exception_notify(){
                  uprobe_pre_sstep_notifier(){
                     //set TIF_UPROBE flag
                  }
               }
         }
      }
   }
}
[...]
exit_to_user_mode_prepare() {
   exit_to_user_mode_loop() {
       uprobe_notify_resume(struct pt_regs * regs){
          handle_swbp(regs){
             handler_chain(find_active_uprobe());
             pre_ssout(){
                xol_get_insn_slot(){
                    get_xol_area(){
                        __create_xol_area(){
                            xol_add_vma(){
                                install_special_mapping();
                            }
                        }
                    }
                }
                arch_uprobe_pre_xol(){
                   regs_set_return_ip(regs, current->utask->xol_vaddr);
                }
                user_enable_single_step();
             }
          }
       }
    }
}
[...]//single_step
uprobe_notify_resume(struct pt_regs * regs){
   arch_uprobe_post_xol(){
      post_xol = default_post_xol_op();
   }
}
To sum up, when the breakpoint is reached, the handlers are executed, and then the original instruction that was replaced by the breakpoint is executed in a special virtual memory area.
Playing with uprobes
We have seen that the uprobes/eBPF combo is a very efficient way to obtain data on all the processes of your system. At Quarkslab for example we created peetch which records all the TLS connections in plaintext (before the encryption process). But can this data be trusted from a security perspective or is it just informative ?
In this section we consider that we write a program that will be monitored/inspected with uprobes. Let’s see what we can do with these uprobes.
Detecting uprobes
Uprobes are based on breakpoints, so we can use common anti-debug tricks to detect them. The quick and dirty way for a monitored program to detect a breakpoint/uprobe is to read its .text memory and search for the breakpoint opcode.
The code snippet below implements this in C, by reading the first byte of tracedFunction and checking if it corresponds to the breakpoint opcode (0xcc).
unsigned char * functionBytes = (unsigned char *) &tracedFunction;

if (functionBytes[0] == 0xcc){
   printf("Detected uprobe breakpoint in beginning of tracedFunction.\n");
}
The problem is that you may have to check every instruction and compare it with the real one in the binary file to avoid false positives.
Another way is to detect a uprobe after it has been triggered. Using our knowledge about the kernel inner workings, we know that a special memory mapping called [uprobes] is created to execute the probed instruction out of line. So our monitored program can read /proc/self/maps and search for such a mapping.
bool detect_uprobes(){
   FILE * memfile = fopen("/proc/self/maps", "r");

   char line[200];
   while(fgets(line, 200, memfile) != NULL){

      char * uprobes_str = strstr(line,"[uprobes]");//search for "[uprobes]" in line
      if(uprobes_str != NULL){
         return true;
      }
   }

   return false;
}
Escaping uprobe monitoring
From the Uprobe activation and Detection of new program instances paragraphs we know that the function valid_vma() is always called before adding the breakpoint. Let’s see the code of this function:
static bool valid_vma(struct vm_area_struct *vma, bool is_register){
   vm_flags_t flags = VM_HUGETLB | VM_MAYEXEC | VM_MAYSHARE;

   if (is_register)
      flags |= VM_WRITE;

   return vma->vm_file && (vma->vm_flags & flags) == VM_MAYEXEC;
}
During the uprobe registering, is_register is enabled. Our code is backed by the program file so vma->vm_file is true, and our code has the execution flag, so VM_MAY_EXEC is also true. The interesting point of this function is that if our code has the VM_WRITE flag, the virtual memory area is not considered to be a valid vma, so the breakpoint is never added in our code section (.text).
A simple way to do that is to edit the permission of the ELF segment containing the .text section, and Quarkslab provides a nice tool to do that: lief.
import lief

prog = "./bin/prog"
binary = lief.parse(prog)

binary.segment_from_offset(binary.get_section(".text").offset).flags = lief.ELF.SEGMENT_FLAGS(7)

binary.write(prog)
Here is a program that combines all these techniques:
char isRoot(int uid){

    if(detect_uprobes()){
        printf("Previous uprobe usage detected.\n");
    }else{
        printf("No uprobe has been activated.\n");
    }

    return uid == 0;

}

int main(int argc, char * argv[]){

    if(argc == 2 && argv[1][0] == '1'){
        unsigned char * funcBytes = (unsigned char *) &isRoot;

        if (funcBytes[0] == 0xcc) {
            int pagesize = sysconf(_SC_PAGE_SIZE);
            char * debut_page = ((char *) &isRoot) - ((long)&isRoot % pagesize);//find page aligned address
            mprotect(debut_page, pagesize, PROT_WRITE | PROT_READ | PROT_EXEC);
            printf("Detected uprobe breakpoint at the beginning of tracedFunction.\n");
            funcBytes[0] = 0xf3;
        }
    }else if(argc != 2 || argv[1][0] != '0'){
        printf("Usage:\n\t%s 0 : to disable anti-uprobe\n\t%s 1 : to enable anti-uprobe\n", argv[0], argv[0]);
        exit(1);
    }

    //PoC function
    isRoot(getuid());

    return 0;
}
This program has two modes: (0) without any detection (i.e. regular execution), and (1) with the detection of breakpoints (and patching) on isRoot. In both cases, it uses the 2nd detection technique to find if any uprobe was activated.
Let’s give it a try:
-------------------------------------------------------     # We begin without uprobe
user@pc:~/ebpf-for-security/uprobe$ ./bin/prog
Usage:
    ./bin/prog 0 : to disable anti-uprobe
    ./bin/prog 1 : to enable anti-uprobe

user@pc:~/ebpf-for-security/uprobe$ ./bin/prog 0
No uprobe has been activated.
Print from testFunction

user@pc:~/ebpf-for-security/uprobe$ gdb ./bin/prog -q       # We find isRoot function offset
Reading symbols from ./bin/prog...
(gdb) p isRoot
$1 = {void ()} 0x1320 <isRoot>

-------------------------------------------------------     # Now we activate the uprobe
root@pc:~# echo 'p:isRootFunction /home/cglenaz/Documents/eBPF/gitlab/ebpf-for-security/uprobe/bin/prog:0x1320 uid=%di:u32' > /sys/kernel/tracing/uprobe_events
-------------------------------------------------------
user@pc:~/ebpf-for-security/uprobe$ ./bin/prog 0
Previous uprobe usage detected.                             # our uprobe is detected!
-------------------------------------------------------     # Let's read the uprobe output:
cat /sys/kernel/tracing/trace_pipe
prog-19936   [013] ..... 19399.726502: isRootFunction: (0x55ff8a5b8320) uid=1000   # The uprobe has intercepted the uid
-------------------------------------------------------
user@pc:~/ebpf-for-security/uprobe$ ./bin/prog 1            # we test the first detection and mitigation strategy
Detected uprobe breakpoint in beginning of testFunction.
No uprobe has been activated.                               # it works
-------------------------------------------------------     # Let's see if something is printed:
cat /sys/kernel/tracing/trace_pipe
                                                            # nothing is printed in trace_pipe because the uprobe is not activated
-------------------------------------------------------
user@pc:~/ebpf-for-security/uprobe$ python3 permission.py   # now we patch the binary with lief
user@pc:~/ebpf-for-security/uprobe$ ./bin/prog 0
No uprobe has been activated.                               # no more uprobe on this program
-------------------------------------------------------
cat /sys/kernel/tracing/trace_pipe
                                                            # nothing again in trace_pipe
-------------------------------------------------------
It works very well on our program's isRoot function but this trick doesn’t work for shared libraries. Plus, you must be root to edit privileged ELF libraries such as the libc one, so you have to modify the permission when they are already loaded in program memory before using them (or you could also write a custom ELF loader that adds write permission to every library). Your program can once-again read /proc/self/maps to find all executable vma from libraries.
Example:
55cc466af000-55cc466b1000 r--p 00000000 fd:01 22282389                   /usr/bin/cat
55cc466b1000-55cc466b5000 r-xp 00002000 fd:01 22282389                   /usr/bin/cat
55cc466b5000-55cc466b7000 r--p 00006000 fd:01 22282389                   /usr/bin/cat
55cc466b7000-55cc466b8000 r--p 00007000 fd:01 22282389                   /usr/bin/cat
55cc466b8000-55cc466b9000 rw-p 00008000 fd:01 22282389                   /usr/bin/cat
55cc4807f000-55cc480a0000 rw-p 00000000 00:00 0                          [heap]
7f32c7ce9000-7f32c7d0b000 rw-p 00000000 00:00 0
7f32c7d0b000-7f32c8af2000 r--p 00000000 fd:01 22287657                   /usr/lib/locale/locale-archive
7f32c8af2000-7f32c8af5000 rw-p 00000000 00:00 0
7f32c8af5000-7f32c8b1d000 r--p 00000000 fd:01 22288450                   /usr/lib/x86_64-linux-gnu/libc.so.6
7f32c8b1d000-7f32c8cb2000 r-xp 00028000 fd:01 22288450                   /usr/lib/x86_64-linux-gnu/libc.so.6
7f32c8cb2000-7f32c8d0a000 r--p 001bd000 fd:01 22288450                   /usr/lib/x86_64-linux-gnu/libc.so.6
7f32c8d0a000-7f32c8d0e000 r--p 00214000 fd:01 22288450                   /usr/lib/x86_64-linux-gnu/libc.so.6
7f32c8d0e000-7f32c8d10000 rw-p 00218000 fd:01 22288450                   /usr/lib/x86_64-linux-gnu/libc.so.6
7f32c8d10000-7f32c8d1d000 rw-p 00000000 00:00 0
7f32c8d30000-7f32c8d32000 rw-p 00000000 00:00 0
7f32c8d32000-7f32c8d34000 r--p 00000000 fd:01 22288113                   /usr/lib/x86_64-linux-gnu/ld-linux-x86-64.so.2
7f32c8d34000-7f32c8d5e000 r-xp 00002000 fd:01 22288113                   /usr/lib/x86_64-linux-gnu/ld-linux-x86-64.so.2
7f32c8d5e000-7f32c8d69000 r--p 0002c000 fd:01 22288113                   /usr/lib/x86_64-linux-gnu/ld-linux-x86-64.so.2
7f32c8d6a000-7f32c8d6c000 r--p 00037000 fd:01 22288113                   /usr/lib/x86_64-linux-gnu/ld-linux-x86-64.so.2
7f32c8d6c000-7f32c8d6e000 rw-p 00039000 fd:01 22288113                   /usr/lib/x86_64-linux-gnu/ld-linux-x86-64.so.2
7ffd18ebb000-7ffd18edc000 rw-p 00000000 00:00 0                          [stack]
7ffd18ee6000-7ffd18eea000 r--p 00000000 00:00 0                          [vvar]
7ffd18eea000-7ffd18eec000 r-xp 00000000 00:00 0                          [vdso]
ffffffffff600000-ffffffffff601000 --xp 00000000 00:00 0                  [vsyscall]
The virtual memory areas of interest:
7f32c8b1d000-7f32c8cb2000 r-xp 00028000 fd:01 22288450                   /usr/lib/x86_64-linux-gnu/libc.so.6
7f32c8d34000-7f32c8d5e000 r-xp 00002000 fd:01 22288113                   /usr/lib/x86_64-linux-gnu/ld-linux-x86-64.so.2
Then for each vma you must unmap the vma with the munmap system call to remove uprobes and remap the exact same vma with the write permission using the mmap system call. There is just one caveat: you can’t use the mmap function from the libc when the libc is unmapped. That’s why you have to hardcode the syscall assembly instruction directly in your program.
extern long int syscall (long int __sysno, ...){

    asm("mov    %rdi,%rax");
    asm("mov    %rsi,%rdi");
    asm("mov    %rdx,%rsi");
    asm("mov    %rcx,%rdx");
    asm("mov    %r8,%r10");
    asm("mov    %r9,%r8");
    asm("mov    0x10(%rbp),%r9");
    asm("syscall");
}

void remove_lib_uprobes(){

   FILE * memfile = fopen("/proc/self/maps", "r");

   char line[200];
   while(fgets(line, 200, memfile) != NULL){

      char * lib_str = strstr(line,".so");//find all libraries
      char * r_xp = strstr(line,"r-xp");// only their code sections

      if(lib_str != NULL && r_xp != NULL){

         //read the start and end address. And the file offset.
         char * dash = strchr(line, '-');
         dash[0] = '\0';
         char * space = strchr(dash + 1, ' ');
         space[0] = '\0';
         char * space2 = strchr(space + 1, ' ');
         space2[0] = '\0';
         char * space3 = strchr(space2 + 1, ' ');
         space3[0] = '\0';

         unsigned long addr1 = strtol(line, NULL, 16);
         unsigned long addr2 = strtol(dash + 1, NULL, 16);
         unsigned long offset = strtol(space2 + 1, NULL, 16);
         unsigned long delta = addr2-addr1;

         //now read the library file name

         // Locate the last occurrence of space in line (the one before the lib name)
         char * name_lib = strrchr(space3 + 1, ' ') + 1;
         name_lib[strlen(name_lib)-1] = 0; //replace the \n by '\0'
         long int fd = open(name_lib,  O_RDONLY);

         syscall(SYS_munmap,(void *) addr1, delta);
         syscall(SYS_mmap,(void *) addr1, delta, (unsigned long) PROT_EXEC | PROT_READ | PROT_WRITE, (unsigned long) MAP_PRIVATE, (unsigned long) fd, (void *) offset);

      }
   }
}
Providing fake information
Now that we can detect and disable uprobes, we could try to send fake context information to an eBPF program hooked on a uprobe. Let’s try to fake the output of sudo peetch tls --content. Our program will send a GET request to the “evil” file but peetch will monitor a request to the “test” file. How is this even possible? We will use a race-condition between the moment where the uprobe breakpoint is triggered and when the message is actually encrypted. The first strategy is to create another thread and hope it will change the filename at the right moment; but this method only works 50% of the time, we can do better. In fact, we have control over our program execution so we can just fork our program into two processes:
a child that calls SSL_write with the fake filename and in which we put a breakpoint just before this call.
a parent that attaches to the child with PTRACE_SEIZE and executes the CHILD one instruction at a time using PTRACE_SINGLESTEP. Starting from the breakpoint we must step the instructions that set the ptrace arguments in registers and the ones that prepare the jump to the library. In our case they consist of exactly 9 instructions between the breakpoint and the second instruction of ptrace. Then when the child is at the second instruction of SSL_write, the uprobe is already executed so we can now change the message buffer from SSL_write to the real filename. We copy the registers using PTRACE_GETREGS, modify the rsi value (rsi is used for the second argument), and call PTRACE_SETREGS. Finally we can resume the child execution with PTRACE_CONT.
Note that this second method requires a higher privilege than the first one because it uses the ptrace syscall.
void SSL_write_race_condition(SSL* ssl, char * realName, char * fakeName){

   char format[] = "GET /%s HTTP/1.0\r\n\r\n";

   int fakeMsgLen = strlen(format) + strlen(fakeName);

   char realMsg[fakeMsgLen];
   char fakeMsg[fakeMsgLen];
   sprintf(fakeMsg, format, fakeName);
   sprintf(realMsg, format, realName);

   printf("\nMessage before the uprobe: %s\n", fakeMsg);

   pid_t pid_fils = fork();

   if(pid_fils != 0){

      ptrace(PTRACE_SEIZE, pid_fils, NULL, NULL);
      printf("Attached\n");
      wait(NULL);

      struct user_regs_struct luser;
      for(int i=0; i<9; i++){//9 instructions between int3 and the first instruction of SSL_write

         ptrace(PTRACE_SINGLESTEP, pid_fils, NULL, NULL);//step one instruction
         wait(NULL);//wait for the step to be done
      }

      ptrace(PTRACE_GETREGS, pid_fils, NULL, &luser);
      luser.rsi = (long long unsigned int) realMsg;//change the SSL_write second argument to our real message
      printf("Set rsi to realMsg...\n");

      ptrace(PTRACE_SETREGS, pid_fils, NULL, &luser) == -1);
      ptrace(PTRACE_CONT, pid_fils, NULL, NULL);//continue the SSL_write
      printf("Continue execution of SSL_write\n");
      exit(1);

   }else{
      ptrace(PTRACE_TRACEME, 0, 0, 0);//wait for the parent to trace this child
      __asm__("int3");//the breakpoint to stop the child just before SSL_write
      SSL_write(ssl, fakeMsg, fakeMsgLen); // encrypt and send message
   }
}
Now, we have to create a test HTTPS server:
from http.server import HTTPServer, BaseHTTPRequestHandler
import ssl
from io import BytesIO


class SimpleHTTPRequestHandler(BaseHTTPRequestHandler):

    def do_GET(self):

        if self.path == "/test":
            self.send_response(200)
            self.send_header('Content-Type', 'text/html')
            self.send_header('Content-Length', str(len(b'<html>Hello, world!</html>\r\n\r\n')))
            self.end_headers()
            self.wfile.write(b"<html>Hello, world!</html>\r\n\r\n")

        elif self.path == "/evil":
            self.send_response(200)
            self.send_header('Content-Type', 'text/html')
            self.send_header('Content-Length', str(len(b'<html>Hello, evil man!</html>\r\n\r\n')))
            self.end_headers()
            self.wfile.write(b'<html>Hello, evil man!</html>\r\n\r\n')

        return True


httpd = HTTPServer(('localhost', 4443), SimpleHTTPRequestHandler)

#first create key : openssl req -x509 -newkey rsa:2048 -keyout key.pem -out cert.pem -days 365
#(example key pass = pass)

httpd.socket = ssl.wrap_socket (httpd.socket,
    keyfile="./key.pem",
    certfile='./cert.pem', server_side=True)

httpd.serve_forever()
This python server responds “Hello, evil man!” if we request the /evil endpoint, and “Hello, world!” for the /test endpoint.
Then we start peetch and launch our attack.
Let’s see the result:
Message before the uprobe: GET /test HTTP/1.0

Attached
rip=0x5613718b8deb
Single-step
rip=0x5613718b8df1
Single-step
rip=0x5613718b8df8
Single-step
rip=0x5613718b8dff
Single-step
rip=0x5613718b8e02
Single-step
rip=0x5613718b8e05
Single-step
rip=0x5613718b8510
Single-step
rip=0x5613718b8514
Single-step
rip=0x7f3fe29ba240
Single-step
Set rsi to realMsg...

Continue execution of SSL_write
[+] Server data received :
HTTP/1.0 200 OK
Server: BaseHTTP/0.6 Python/3.10.4
Date: Wed, 06 Jul 2022 09:25:21 GMT
Content-Type: text/html
Content-Length: 29

<html>Hello, evil man!</html>
It works well, the filename was replaced before the message is sent, so we receive the “Hello, evil man!” message. Let’s check if peetch is aware of our evilness:
<- client (12918) 127.0.0.1/4443 TLS1.3 None

   0000  47 45 54 20 2F 74 65 73 74 20 48 54 54 50 2F 31  GET /test HTTP/1
   0010  2E 30 0D 0A 0D 0A 00 00                          .0......

-> client (12918) 127.0.0.1/4443 TLS1.3 None

   0000  48 54 54 50 2F 31 2E 30 20 32 30 30 20 4F 4B 0D  HTTP/1.0 200 OK.
   0010  0A 53 65 72 76 65 72 3A 20 42 61 73 65 48 54 54  .Server: BaseHTT
   0020  50 2F 30 2E 36 20 50 79 74 68 6F 6E 2F 33 2E 31  P/0.6 Python/3.1
   0030  30 2E 34 0D 0A 44 61 74 65 3A 20 57 65 64 2C 20  0.4..Date: Wed,
The attack is successful, peetch has monitored the fake message!
Our attack now works every time a message is sent and it can easily be adapted to different situations. Therefore, we can use this attack to provide fake information to any uprobe detected with the previous methods.
Looking from the other side, this attack is easy to detect. You can use kprobes to trace any PTRACE_SETREGS and watch if the rip register is in the function that contains your uprobe. However, the attack can also be done using threads (with less accuracy) and would be more difficult to detect. But anyway, what would be the point of working on it if an attacker can use our previous tricks and easily disable any uprobe?
Conclusion
We found that a program can do whatever we want to fool uprobes on its own code and libraries, thus eBPF programs based on uprobes are not a reliable way to monitor untrusted programs, they are however a powerful tool to gather information. If you want to monitor a program to detect malicious behavior, kprobes are more suitable for this purpose. They offer basically the same features as uprobes but on the kernel side. The race-condition can still be an issue with them so it is better to hook kprobes at secure points like those defined in LSM (Linux Security Modules).